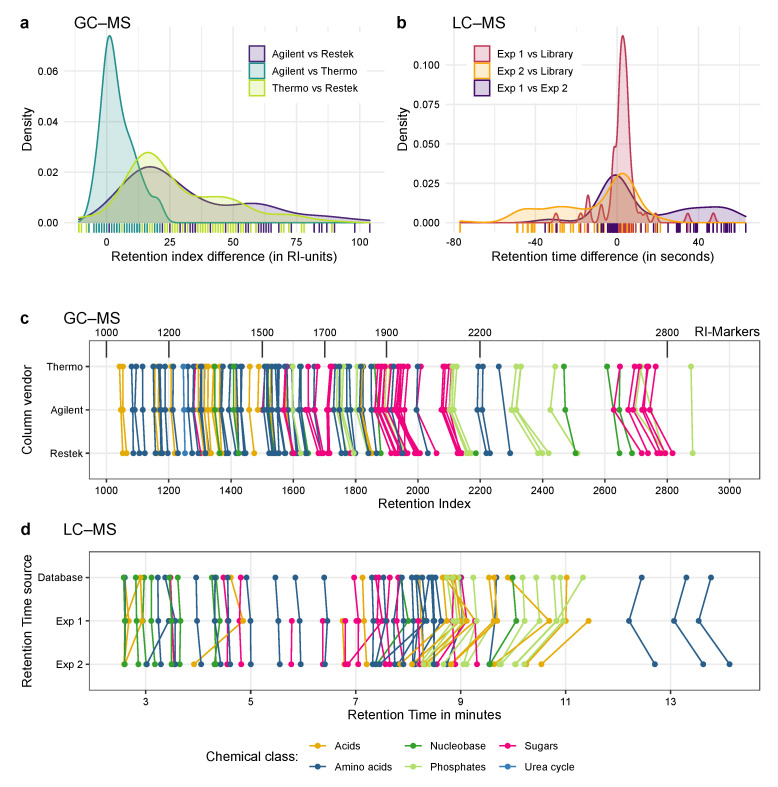
Figure 5.
Application of the Ident-Mix for retention validation and compound identification by GC–MS and LC–MS. (a,c) Testing retention of metabolites by GC–MS with three GC columns (same polarity, different vendors) and identical machine and temperature program. (b,d) Testing retention of metabolites by LC–MS with two different LC columns (same make and model) and identical machine solvent gradient. (a) Histogram showing the RI differences for the GC-experiment, overall the columns from Agilent and Thermo are the most similar. (b) Histogram showing the rt-differences for the LC-experiment, here experiment 1 matches the database entries more closely than the second experiment. (c) Retention indices of compounds in the GC-experiment for the three setups. Coloured lines connect the same metabolite, black lines denote RI-markers. If a point is missing, no peak was detectable. (d) Retention times of compounds in the LC experiment for the database and two measurements. Coloured lines connect the same metabolite, if a point is missing no peak was detectable or the metabolite was not present in the in-house database. Overall RT values from experiment 1 are closer to the library entries than experiment 2.

