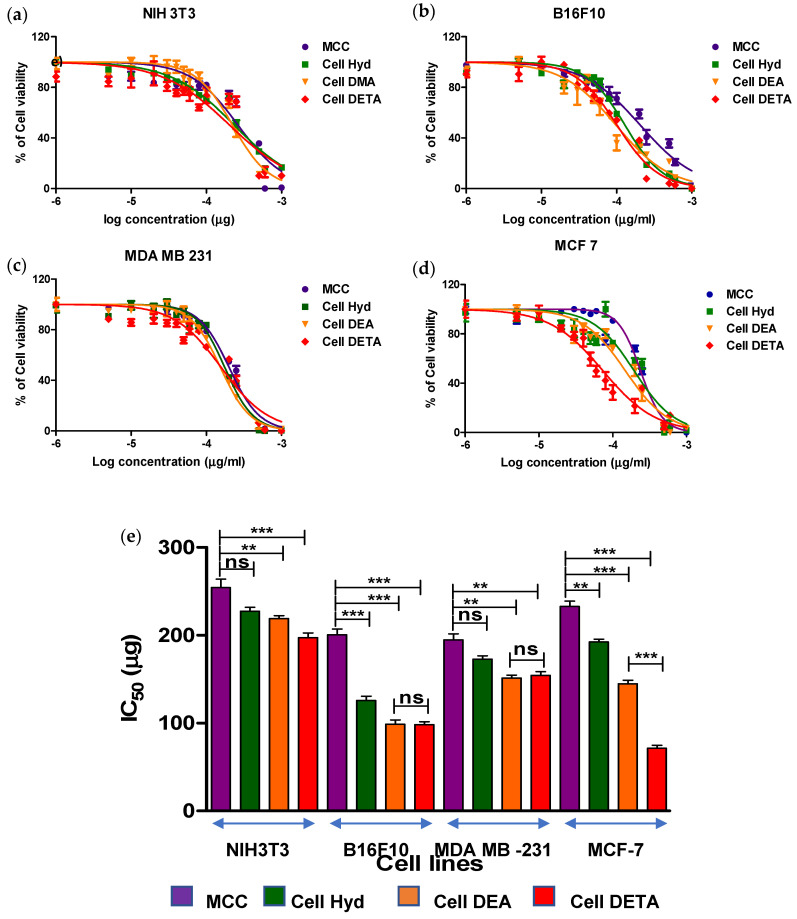
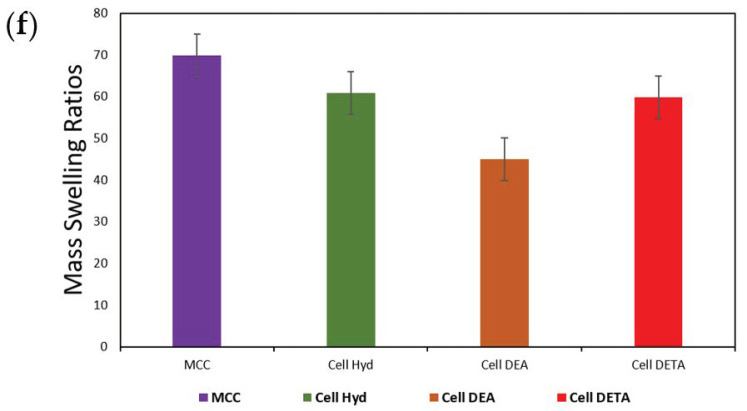
Figure 4.
Cell Culture Evaluating the IC50 values for the Cellulose and its derivative MCC, Cell Hyd, Cell DEA and Cell DETA ± average standard deviation (* p < 0.05, ** p < 0.01, and *** p < 0.001) against Normal. (a) NIH3T3 and Cancer cell lines. (b) B16F10. (c) MDA-MB-231. (d) MCF-7. (e) IC50 values graph. (f) Swelling ratios of cell derivatives.


