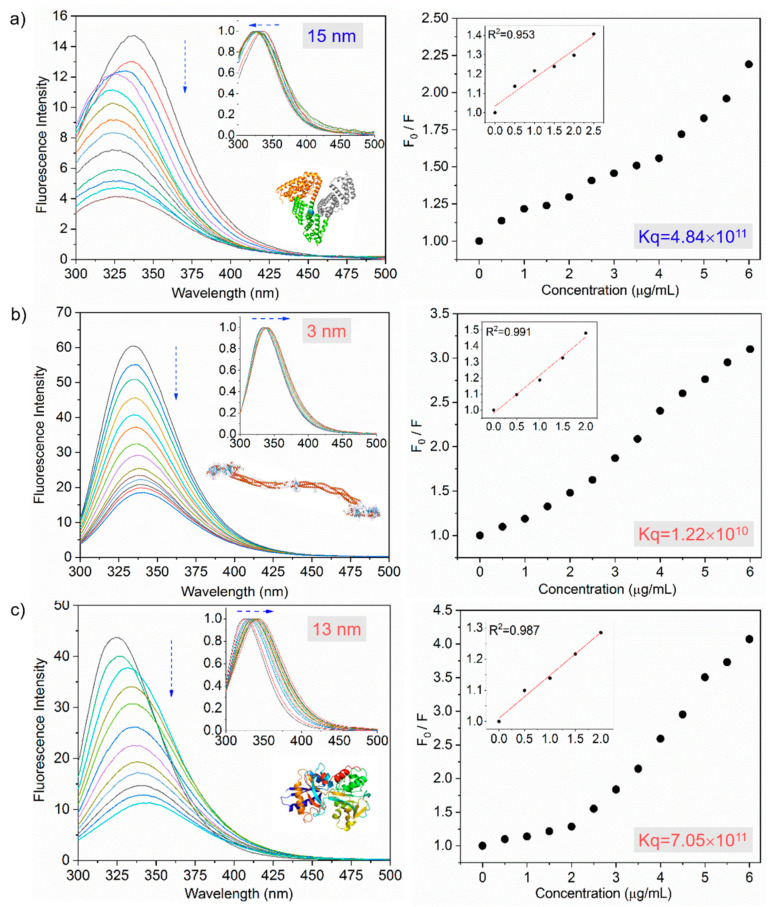
Figure 3.
Fluorescence quenching (down arrow) of plasma proteins by SiQDs/F127 nanoparticles. Fluorescence emission spectra and its corresponding Stern–Volmer plots of human serum albumin (a), fibrinogen (b), and transferrin (c) in the absence and presence of SiQDs/F127 nanoparticles. The left side panel’s inset shows the spectral shift (horizontal arrows) of protein after interaction with the nanoparticles. The inset of the right-side panel shows the Stern–Volmer plots of proteins at lower concentrations after interaction with nanoparticles. Kq represents the quenching constant after the addition of nanoparticles. Protein crystal structures are taken from the protein data bank.

