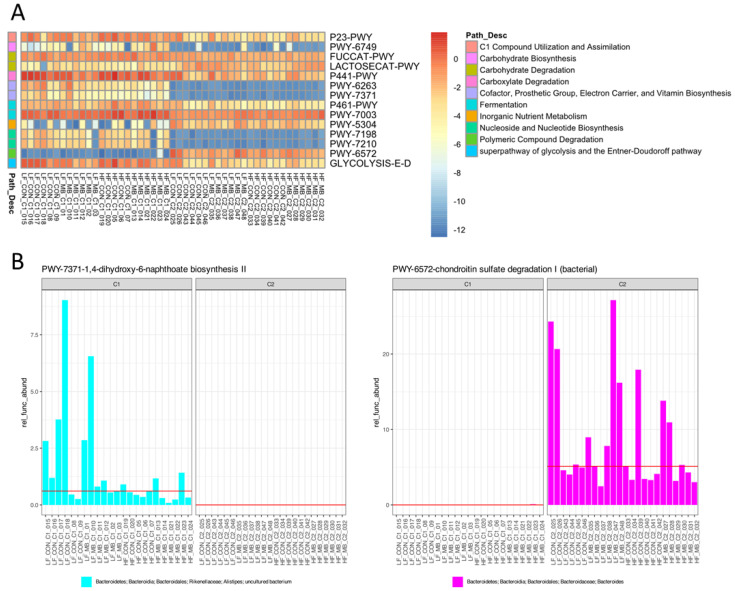
Figure 7.
Metacyc pathways identified as differentially abundant between cohorts by metagenome inference using PICRUSt2. (A). Heatmap of most highly upregulated and downregulated Metacyc pathways across cohorts selected by Benjamini–Hochberg-adjusted Welch’s t test and Wilcoxon rank sum p ≤ 0.05 and effect cutoff of ±1. (B). Two pathways that demonstrated unique abundance in cohort 1 (left) or cohort 2 (right) shown with their contributing taxa.

