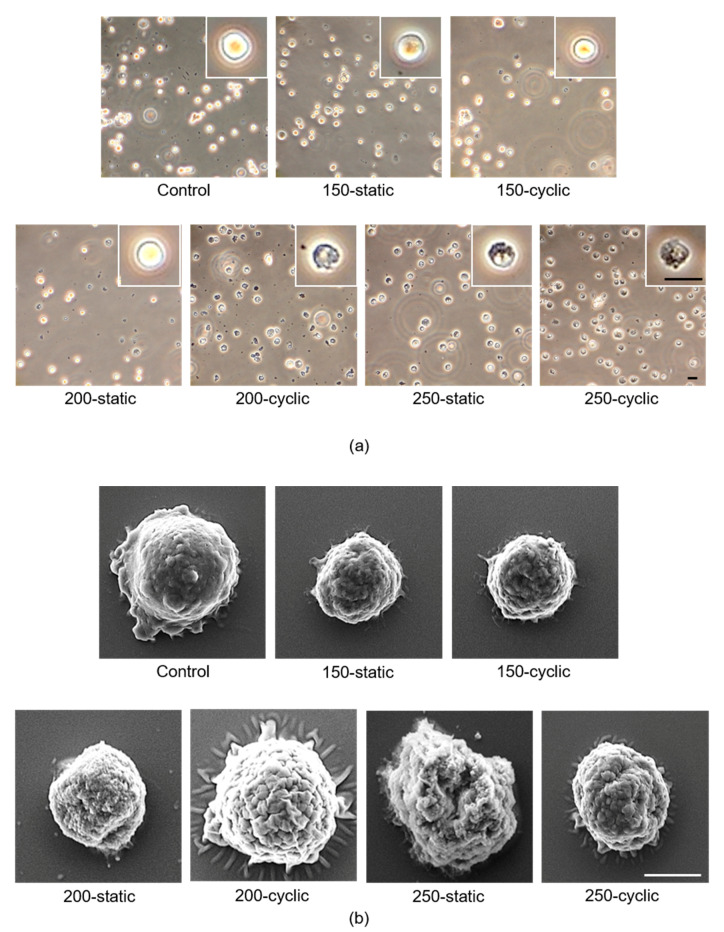
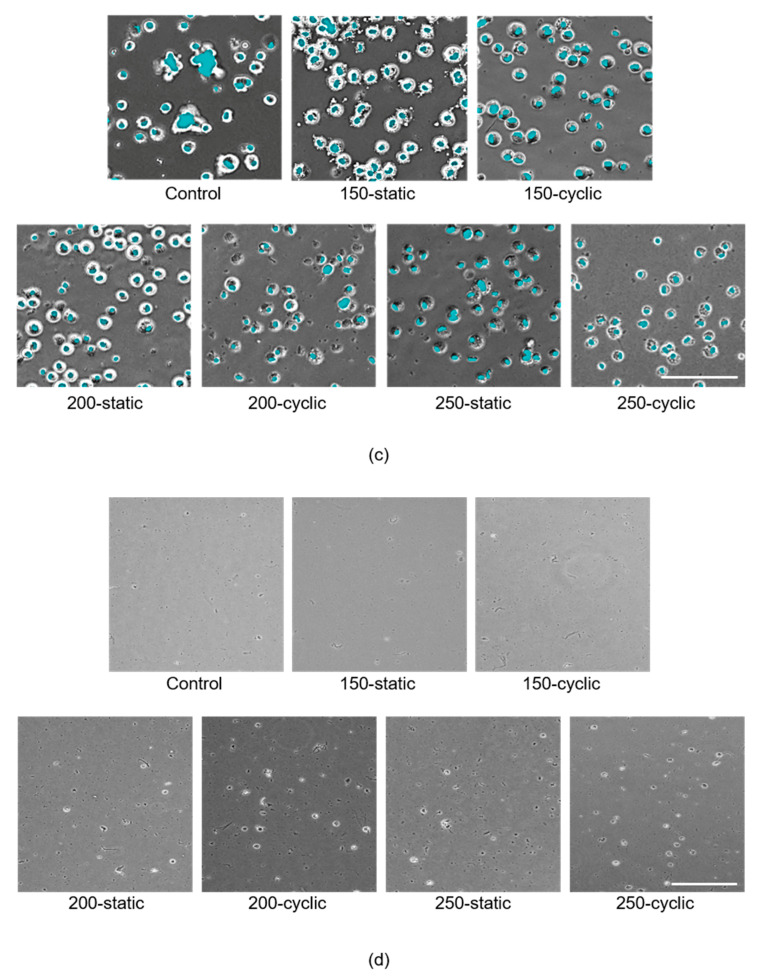
Figure 4.
Evaluation of damage to cell membrane and nucleus of NB1RGB cells. (a) Phase-contrast images of NB1RGB cells precipitated by centrifugation. Scale bar: 200 μm. (b) Scanning electron microscopy images precipitated by centrifugation. Scale bar: 5 μm. (c) Hoechst staining precipitated by centrifugation. Scale bar: 100 μm. (d) Phase-contrast images of the supernatant. Scale bar: 300 μm.


