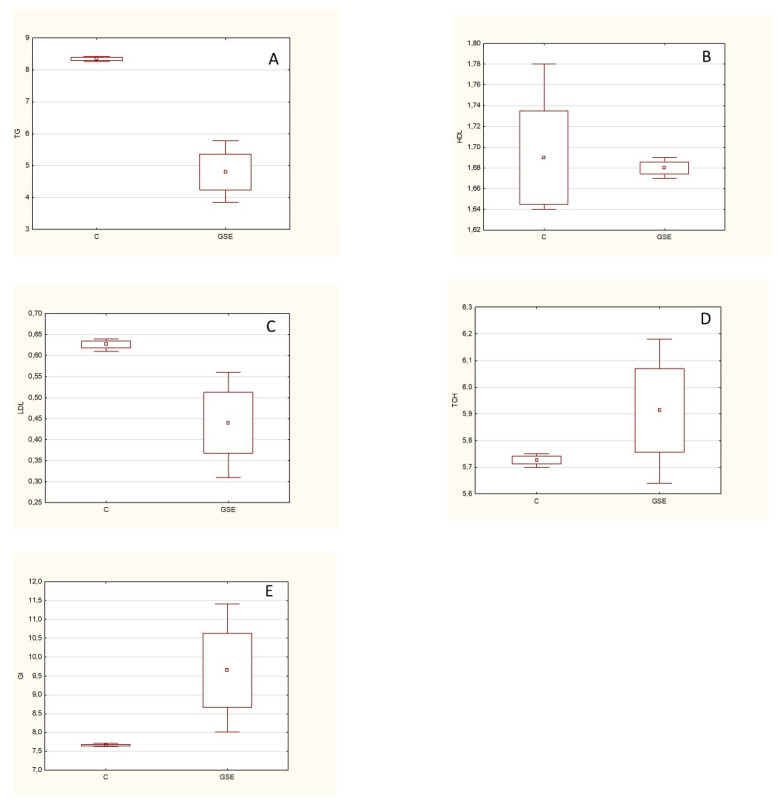
Figure 6.
Concentration values: (A) TGC, (B) HDL, (C) LDL, (D) TCH, and (E) GL. C—control group, GSE—variant with the addition of GSE. The values of biochemical markers are expressed in mmol/L. The results of lipid metabolism showed significant changes in the values of TGC, LDL (p < 0.05), and glucose (p > 0.05). From these results, it can be stated that the administered extract has a positive effect on these monitored parameters. A: TGC p < 0.05; B: HDL p > 0.10; C: LDL p < 0.05; D: TCH p > 0.10; E: GL p > 0.05

