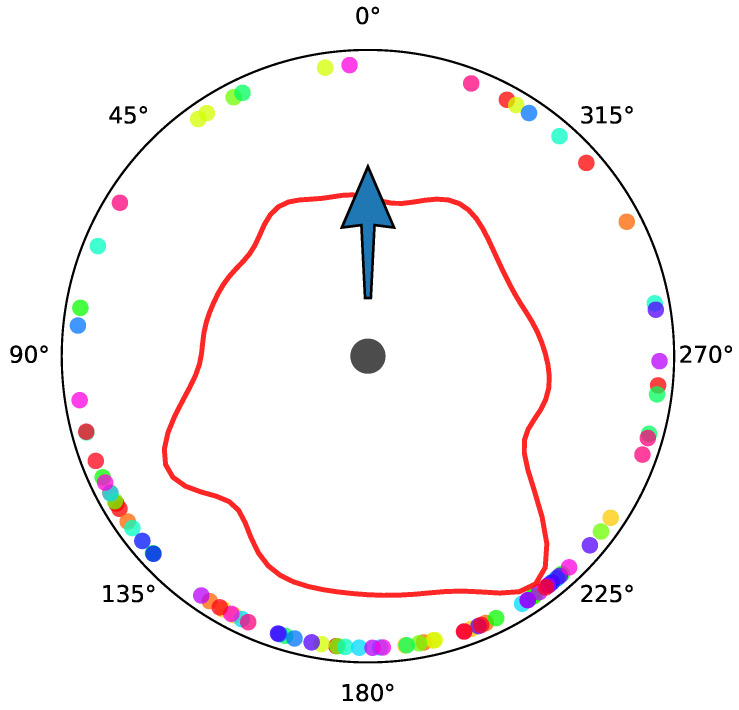
Figure A1.
Directions of target objects in scenes relative to the observer’s starting directions (blue arrow pointing north) after collapsing the up axis (view from above). The dots represent individual target objects, their color refers to the scene they belong to. The polar density distribution of directions is shown as a red curve (estimated with a von Mises kernel). Color-to-scene legend: ● B01, ● B02, ● B03, ● K01, ● K02, ● K03, ● L01, ● L02, ● L03, ● O01, ● O02, ● O03, ● O04, ● S01, ● S02, ● S03 (where B means bathroom, K means kitchen, L means living-room, O means office and S means bedroom).

