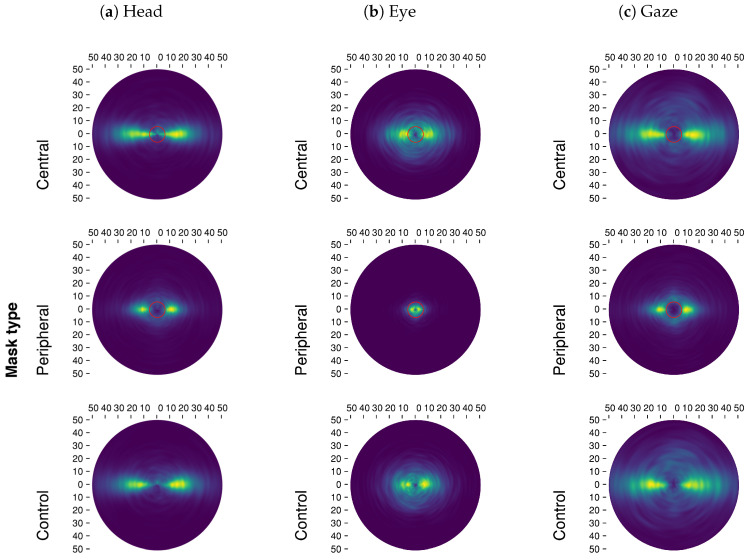
Figure A2.
The joint distribution of saccade amplitudes and saccade absolute directions are presented in this figure for eye, head and gaze movements as a function of mask conditions. Red circles at the center of the polar plots show masks’ radius (six deg.). A brighter color represents a higher density of saccades.

