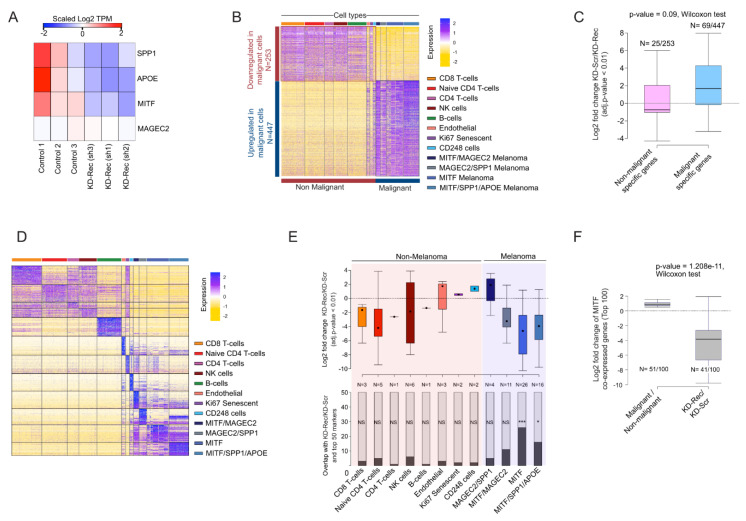
Figure 7.
(A) Heatmap visualization of scaled (Log2 TPM) expression of SPP1, MITF, APOE, and MAGEC2 upon knockdown (KD) of Rec in A375 cells (three replicates). (B) Heatmap visualization of scaled expression [log TPM (transcripts per million)] values of a distinctive set of ~1500 genes (Log2 fold change >1 and >50% of cells expressing either in Non-malignant or Malignant cells), which are differentially expressed in scRNA seq data. The color scheme is based on Z-score distribution from −2.0 (gold) to 2.0 (purple). Top color bars highlight representative gene sets specific to the respective clusters. (C) Box plot showing the comparison of differentially expressed gene sets in Malignant and Non-malignant cells (patient-derived scRNA-seq) and KD-Rec vs. KD-Scr in A375. (D) Heatmap showing the expression dynamics of the top 50 marker genes for each cluster. Color scheme and annotation as in Figure 7B. (E) Lower panel: Stacked barplot showing the number of marker genes that are detected among the DEGS upon Rec KD in A375. Stars indicate the significance (p-value < 0.01, two-sided fisher-exact test) Upper panel: Differential expression of overlapping genes are represented at Log2 fold change scale upon Rec KD in A375. The color scheme of each box represents the corresponding cell clusters. (as in Figure 7B). (F) Box plot showing the comparison differential expression of a gene set of “MITF-High” (consisting of MITF itself and the top 100 genes correlated with MITF expression) between Malignant and Non-malignant cells (patient-derived scRNA-seq) and KD-Rec vs. KD-Scr in A375.

