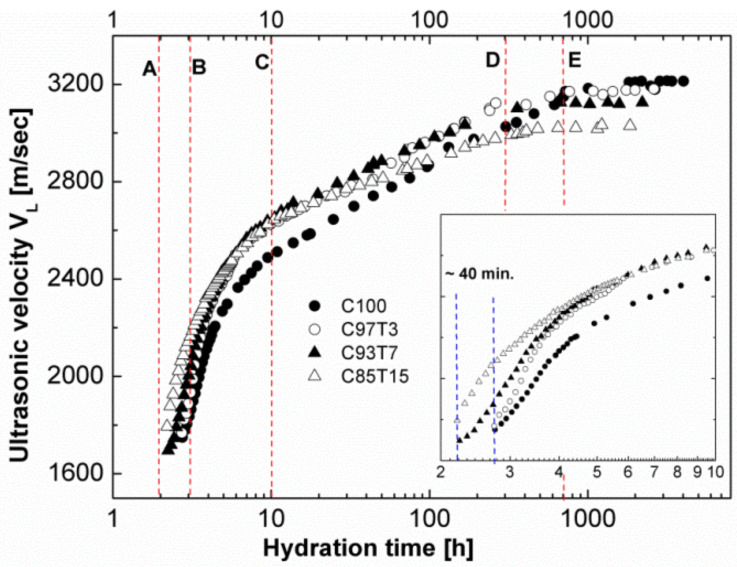
Figure 3.
Ultrasonic longitudinal velocity versus hydration time for the samples used in this study. The inset presents the data during the first ten hours of hydration time. The vertical dashed lines are presented for clarification and to indicate the different hydration periods as discussed within the text.

