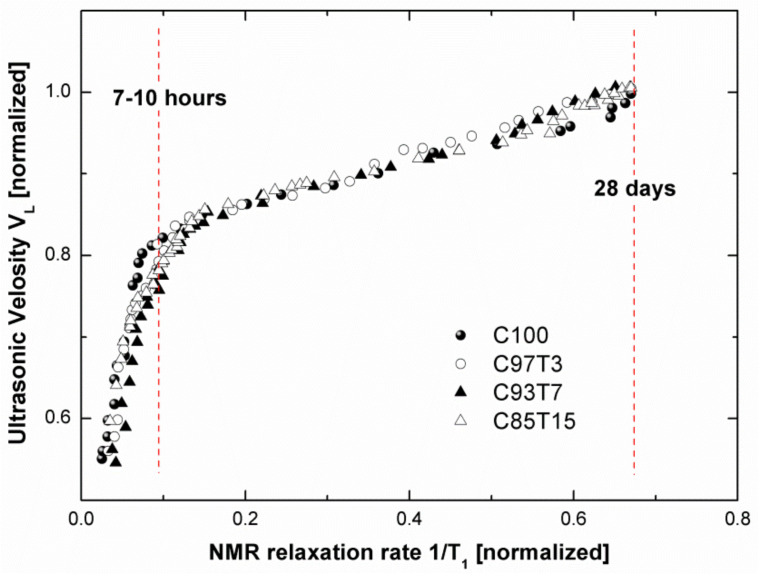
Figure 10.
Correlation between ultrasonic longitudinal velocity and NMR relaxation rates. Both are normalized and the hydration times are taken as implicit parameters. Two distinct regions of linear correlations between VL and 1/T1 are observed from the starting time until ~7–10 h and ~7–10 h until 28 days.

