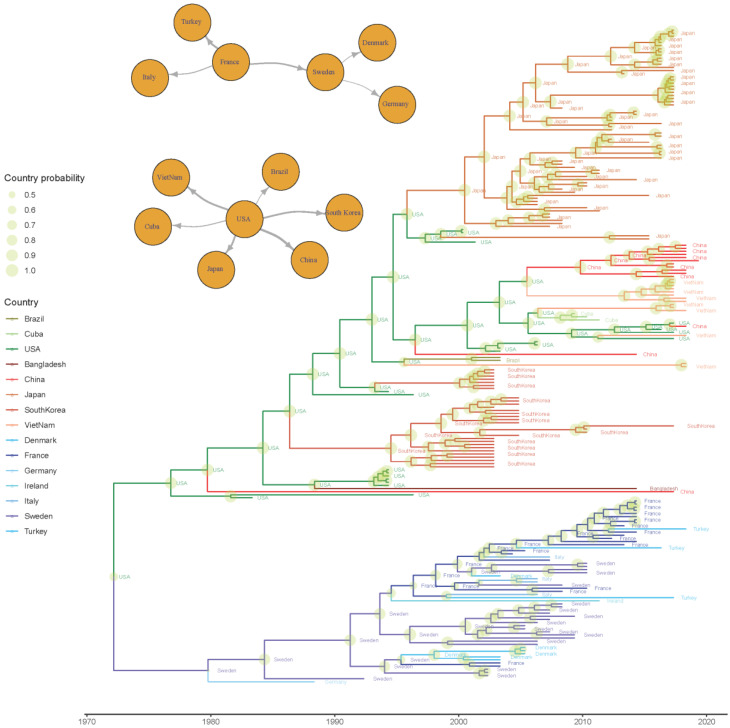
Figure 4.
Time-scaled phylogenetic tree based on BoCV spike protein. The estimated ancestral geographic location has been color-coded (different nuances of green, red, and blue have been selected for American, Asian, and European countries), while the posterior probability is depicted as a circle on the corresponding node, whose size is proportional to the estimated value. The statistically supported migration routes have been represented in the upper left insert.

