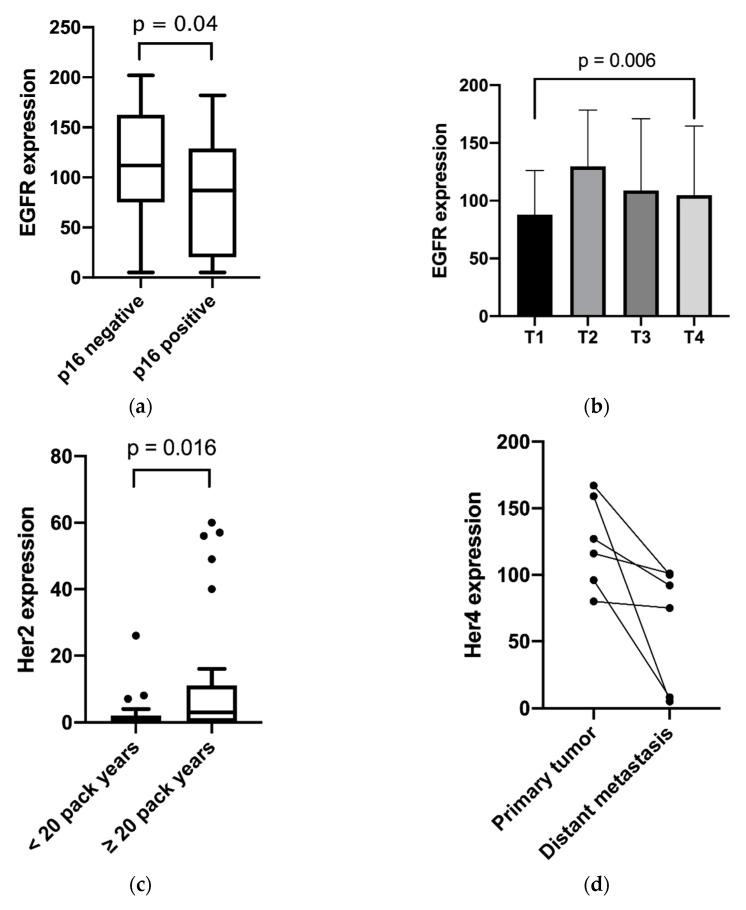
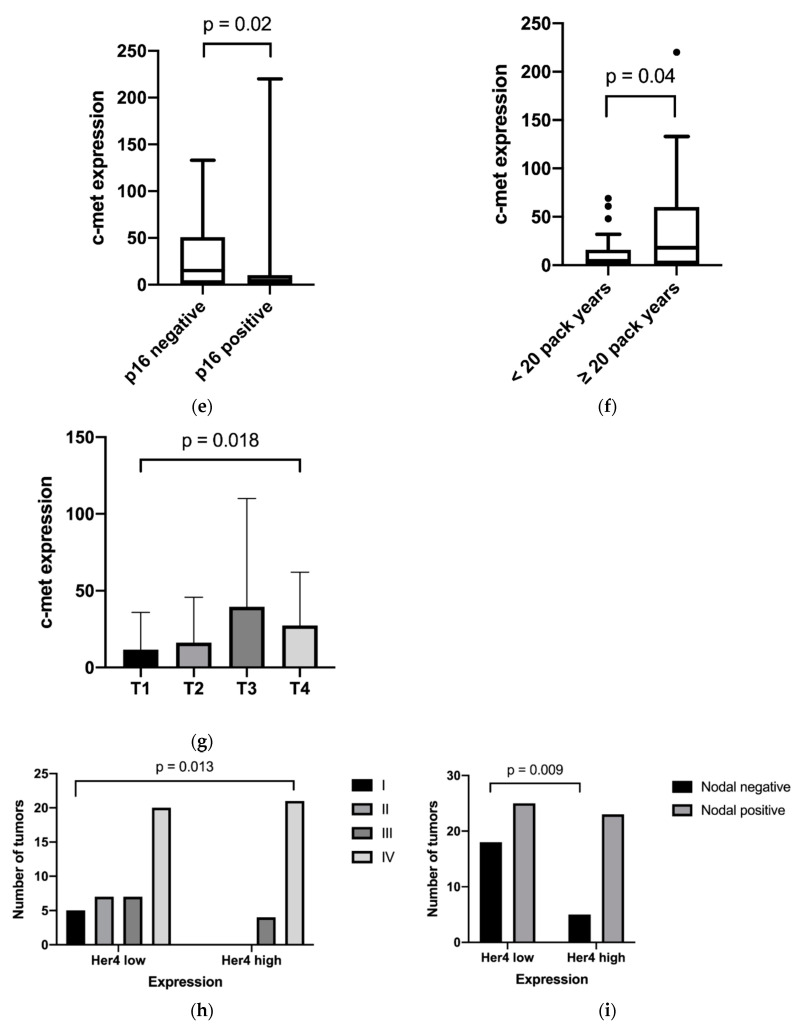
Figure 2.
Expression distribution of growth factor receptors in relation to the clinical features: (a) EGFR and p16 expression; (b) EGFR expression and T category; (c) Her2 expression and pack years; (d) Her4 expression and tumor site; (e) c-Met and p16 expression; (f) c-Met expression and pack years; (g) c-Met expression and T category; (h) Her4 Expression and tumor stage; and (i) Her4 expression and nodal positivity. (a,c,e,f) Box plots with whiskers showing median, quartiles, maximum and minimum; (b,g) column bar graphs showing mean with standard deviation; (d) column bar graph showing before and after values; and (h,i) interleaved bars comparing absolute values.


