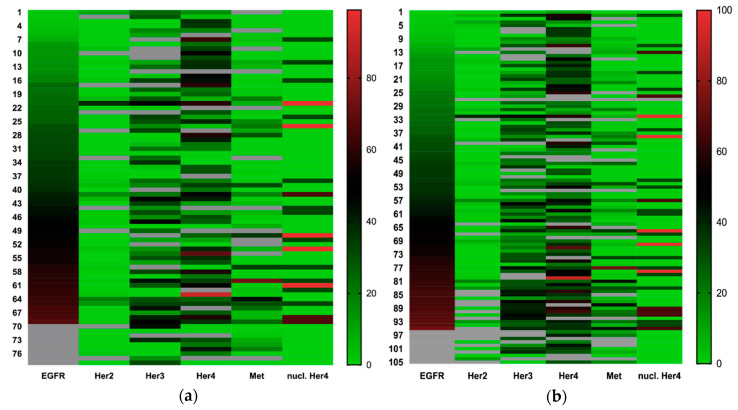
Figure 3.
(a) Heatmap of growth factor receptor expression in primary tumors sorted by EGFR expression and expression values converted from a 0–300 to a 0–100 scale; and (b) heatmap of growth factor receptor expression in all assessed tumor tissues (primary tumor, local recurrent tumor, lymph node metastasis and distant metastasis) sorted by EGFR expression, expression values converted from a 0–300 to a 0–100 scale.

