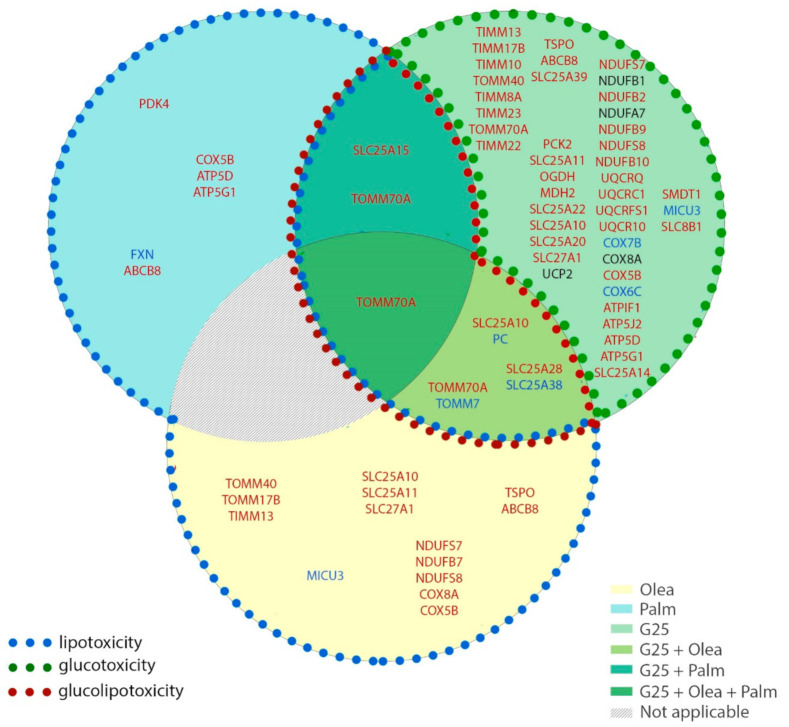
Figure 7.
Stress-specific mitochondrial transcriptome profile of human islets upon lipotoxic, glucotoxic, and glucolipotoxic conditions. Isolated human islets were exposed for 3 days to different culture conditions: 25 mM glucose (G25) in the green circle, 0.4 mM oleate (Olea) in the yellow circle, and 0.4 mM palmitate (Palm) in the blue circle. The superimposition of the circles represents the mix of the corresponding conditions: G25 + Olea in the superimposition of the green and yellow circles, G25 + Palm in the superimposition of the green and blue circles, and G25 + Palm + Olea in the superimposition of the three conditions. The condition corresponding to Palm + Olea at G5.5 was not tested (not applicable). The circle sections contain the genes whose expression is modified upon that specific stress condition. Colors reflect positive (red), negative (blue) or variable (black) changes in mRNA. Significant changes were considered when two or more independent islet batches (donors) exhibited down or upregulation with a log2 FC threshold of 0.5 associated with one or more adjusted p < 0.05.

