Figure 1.
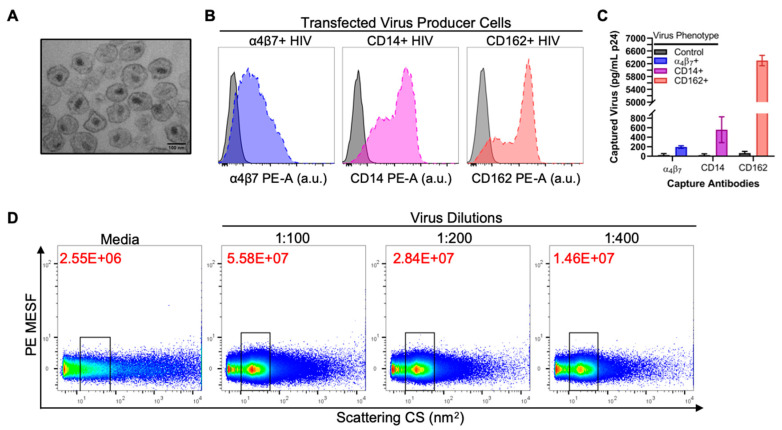
Validation and quality control of viral stocks to be used in flow virometry. (A) HIV-1 pseudoviruses (SG3Δenv) used in this study as visualized by transmission electron microscopy. Image shown represents free virions from one section of virus-producing HEK293 cells and was reproducible across 5 different cell sections that were imaged. (B) Cell surface expression of transfected host proteins (α4β7, CD14, or CD162) as analyzed by flow cytometry. Colored dotted line histograms indicate positive staining when the respective host protein was co-transfected (α4β7+, CD14+, or CD162+) with SG3Δenv, while control (grey solid line) histograms indicate negative staining with the anti-host protein antibodies on cells producing control virus (SG3Δenv alone), without co-transfection of host protein. (C) Detection of virion-incorporated host proteins by antibody capture assay, with each virus type indicated by a different bar color (“virus phenotype” containing different host proteins). Control virus contains no host protein, only the SG3Δenv backbone. Captured virus is presented as the amount of p24 (pg/mL) after lysis of bead-associated virus. Data shown indicate the mean level of virus capture +/− SD for duplicate samples after removal of the background noise (non-specific IgG capture). (D) Serially diluted (1:100, 1:200, 1:400) preparations of unstained control HIV are shown with gating on the pseudovirus population. Particle concentrations (particles/mL) were calculated based on events in the gated regions when acquired at a sample rate of 10 µL/min for 1 min, denoted in red on each dot plot. Media alone is shown to indicate the level of instrument noise and background noise present.

