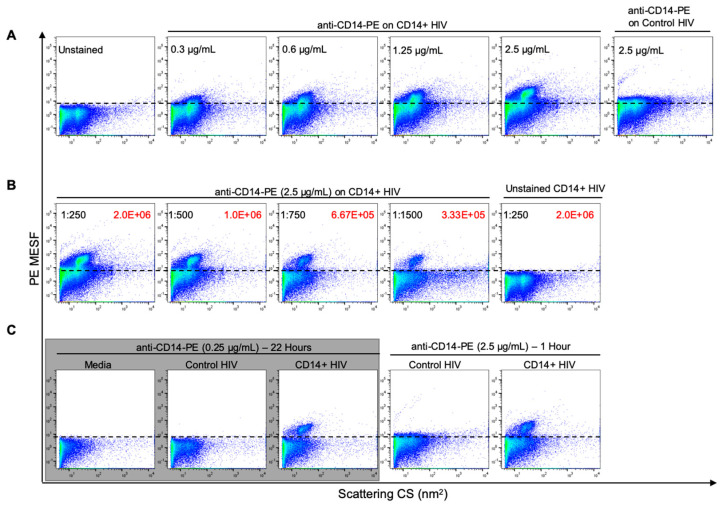
Figure 3.
Optimization of antibody labeling protocol for phenotypic analysis of HIV pseudoviruses by flow virometry. (A) Titration of an anti-CD14-PE antibody on CD14+ HIV, stained for 1 h at room temperature (RT). Unstained virus and a control virus (without CD14) stained at the maximum concentration (2.5 µg/mL) of antibody tested are shown for comparison. (B) Dilution series of CD14+ virus labeled with 2.5 µg/mL of anti-CD14-PE to demonstrate reduction of background fluorescence from coincidence. Virus dilutions are shown in black, with associated particle concentrations (particles/mL) shown in red. (C) Reduction of coincidence through ten-fold reduction in antibody concentration and increased staining time, as seen when comparing the data in the grey box (left three plots) to the right panel (two plots). The staining time was increased from 1 h at RT to overnight at 4 °C to obtain an equivalent level of labeling as seen in (B). This optimized protocol (denoted with the grey box) was used for all subsequent staining procedures. Events above the dashed lines indicate positive labeling or increased background fluorescence due to coincidence. This line was set directly above the level of background fluorescence seen on unstained virus or cell culture media. For each panel, a range of dilutions were tested to ensure that the observed results were reproducible across multiple conditions and were not due to coincidence.

