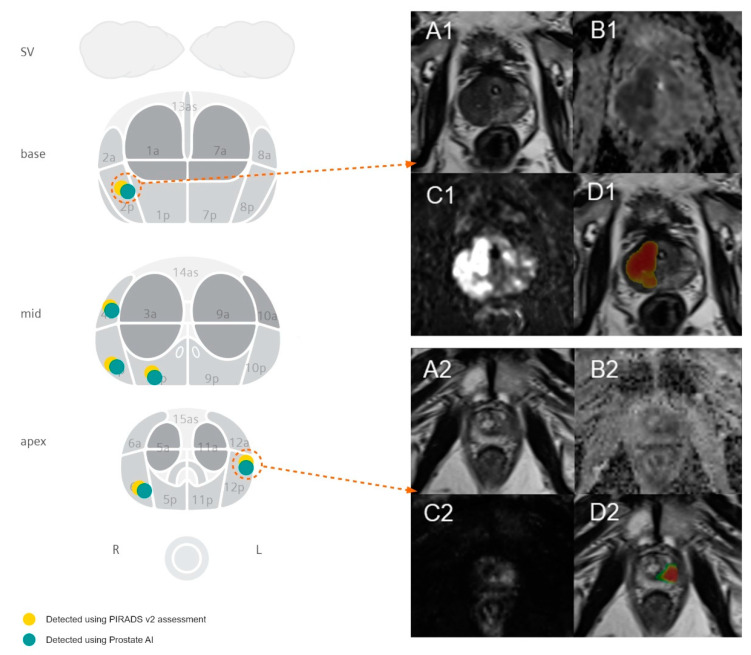
Figure 3.
Figure showing the visualization of the automated detection of PI-RADS 5 lesions with positive biopsy results in the peripheral zone in two exemplary cases. The left-hand-side image visualizes the spatial distribution of lesions in our study cohort with a positive biopsy result. Case 1 (A1–D1) demonstrates a PI-RADS 5 lesion in the left mid-gland PZpl/PZa with a maximum diameter of 35.0 mm and a mean ADC value of 758 s/mm2 for 62-year-old men, using the deep learning algorithm. Biopsy results revealed a Gleason 4 + 3 = 7 pattern. Case 2 (A2–D2) demonstrates a PI-RADS 5 lesion in the right apical PZpl with a maximum diameter of 15.5 mm and a mean ADC value of 961 s/mm2 for 51-year-old men, using the deep learning algorithm. Biopsy results revealed a Gleason 3 + 3 = 6 pattern. (A) are showing the T2-weighted images, (B) the ADC maps, (C) the high-b value images (b value of 800), and (D) the T2-weighted sequences with overlaying heatmaps displaying the probability of a lesion with red being highly probable and green being less probable as predicted from the algorithm. Both lesions were scored as PI-RADS 5 lesions.

