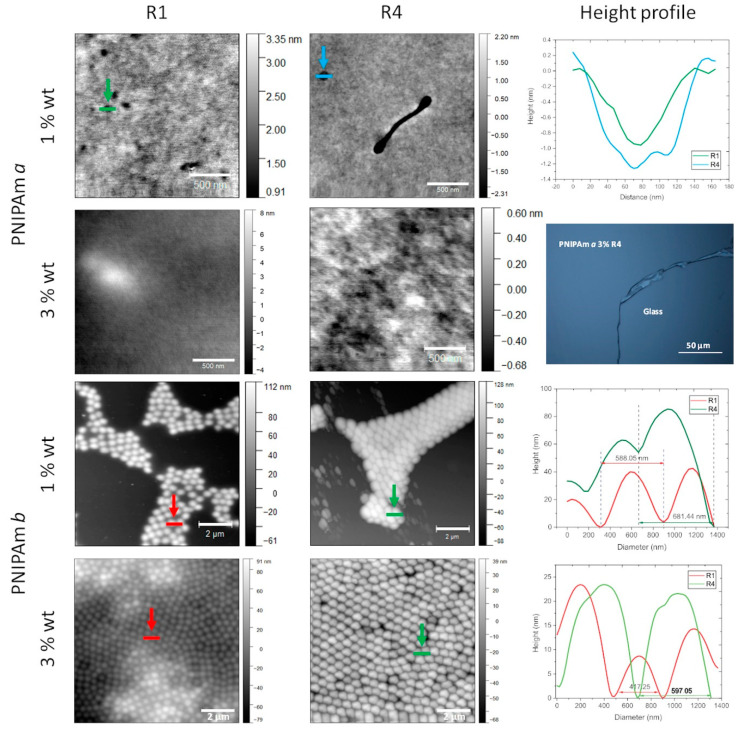
Figure 2.
AFM images of PNIPAm a (from top, rows 1 and 2) and PNIPAm b (rows 3 and 4) films spin-coated at different concentrations (1 wt%, rows 1 and 3; 3 wt%, rows 2 and 4) and different spin-speed values (from left: column 1, R1 = 2000 rmp; column 2, R4 = 5000 rpm). Graphs on column 3, rows 1, 3, and 4, display the height profiles measured in correspondence of the lines shown in the images of column 1 (red lines) and 2 (green). On column 3, row 2, an image of the sample, obtained via optical microscopy.

