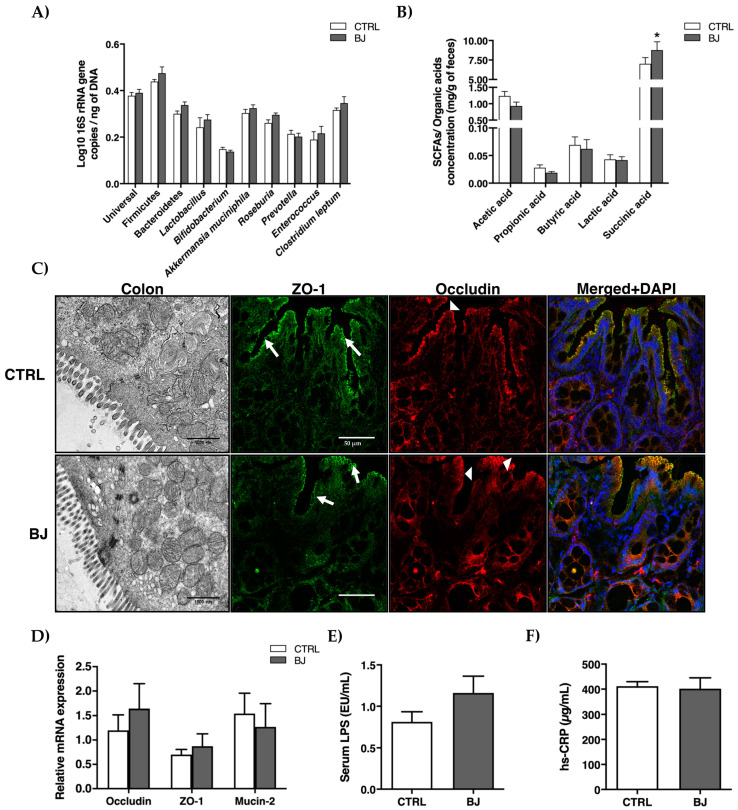
Figure 1.
Gut microbiota composition (A), SCFAs, and organic acids (B) in feces; ultrastructural distribution of tight junctions and representative confocal images of colon section stained for ZO-1 (arrow) and occludin (arrowhead) (C) and mRNA expression (D) of key players of tight junctions; serum LPS (E) and hs-CRP (F) concentrations. Data are presented as mean ± SEM (n = 6–8/group); * p < 0.05 vs. CTRL group.

