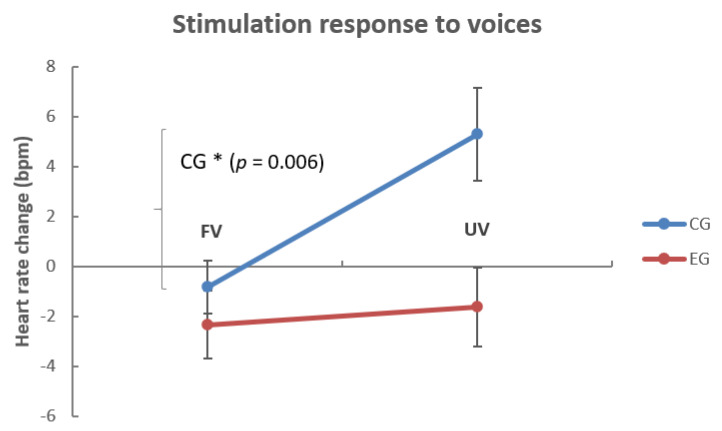
Figure 2.
Change in HR (beats per minute) in dependence of voice familiarity. The figure shows the HR change (in beats per minute) from (4×) 180 s of the preceding baseline to (4×) 180 s stimulus presentation in infants who were prenatally exposed to auditory stimulation (EG; n = 22) and who were not exposed (CG; n = 12). Note that only in the CG did the HR increase to the unfamiliar voice, with respect to the HR change in the EG, that is not significantly different from baseline. HR = heart rate, EG = experimental group, CG = control group, FV = familiar voice, UV = unfamiliar voice. Data were pooled for both recordings two and five weeks after birth. Error bars refer to +/− 1 SEM.

