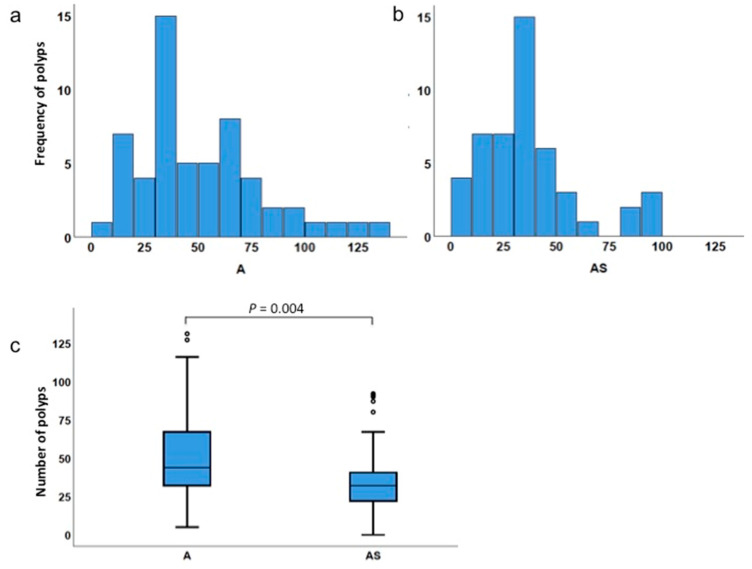
Figure 2.
Polyp incidence in ApcMin/+ and ApcMin/+;Sf1+/− intestines. (a,b) Frequency distribution of number of polyps in ApcMin/+ (A) and ApcMin/+;Sf1+/− (AS) mice. (c) Box plot comparing total number of polyps in ApcMin/+ (A) and ApcMin/+;Sf1+/− (AS) mice. The box plots are a graphical representation of the five-number-summary for the number of polyps: the minimum value (the bottom whisker), first quartile (lowest line of the box), median or second quartile (line inside the box), third quartile (top line of the box), and maximum value (top whisker). Actual values are listed in Table 4.

