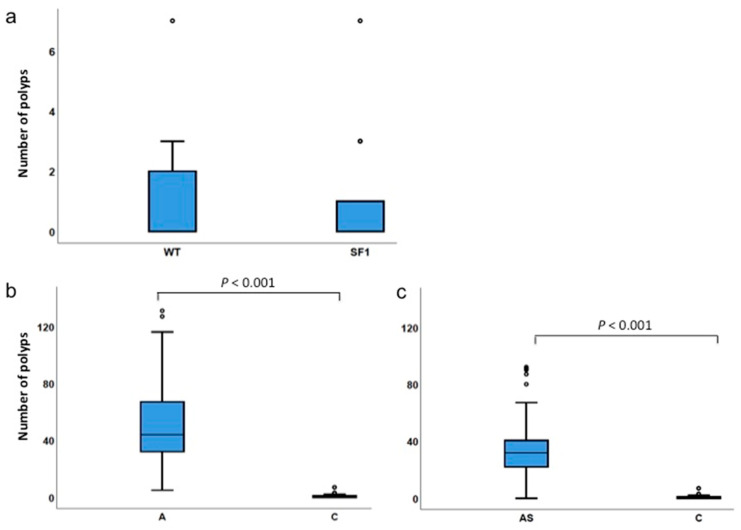
Figure 4.
Polyps in WT and Sf1+/− mice. (a) Comparison of polyp numbers in wild-type (WT) Sf1+/+ and Sf1+/− genotypes; (b) ApcMin/+ and control (Sf1+/+ and Sf1+/−) genotypes; and (c) ApcMin/+;Sf1+/− and control genotypes. Quartile values are represented as described in the legend of Figure 2. Actual values are listed in Table 4.

