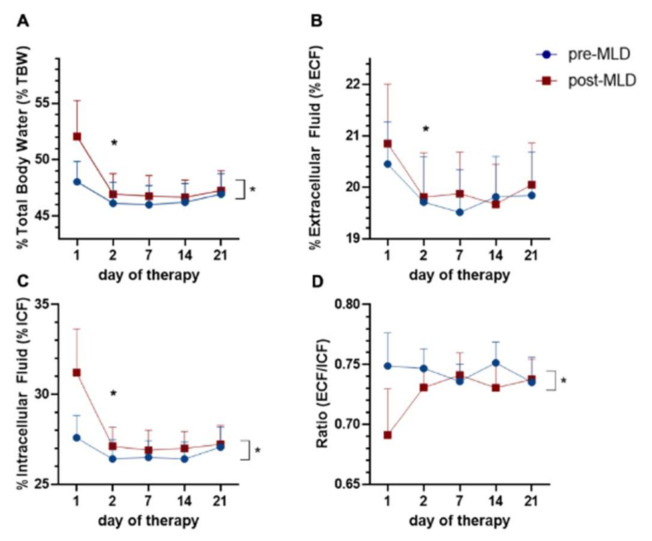
Figure 5.
Time course of percental changes, of (A) total body water (%TBW), (B) extracellular fluid (%ECF), (C) intracellular fluid (%ICF), to the individual patient’s body weight, as well as (D) extracellular fluid normalized to intracellular fluid (ECF/ICF) over three weeks of complete decongestive therapy (CDT) and due to manual lymphatic drainage (MLD). The blue circles represent values pre-MLD, the red boxes indicate fluid concentrations post-MLD. Asterisks (*) represent significant differences (p < 0.05).

