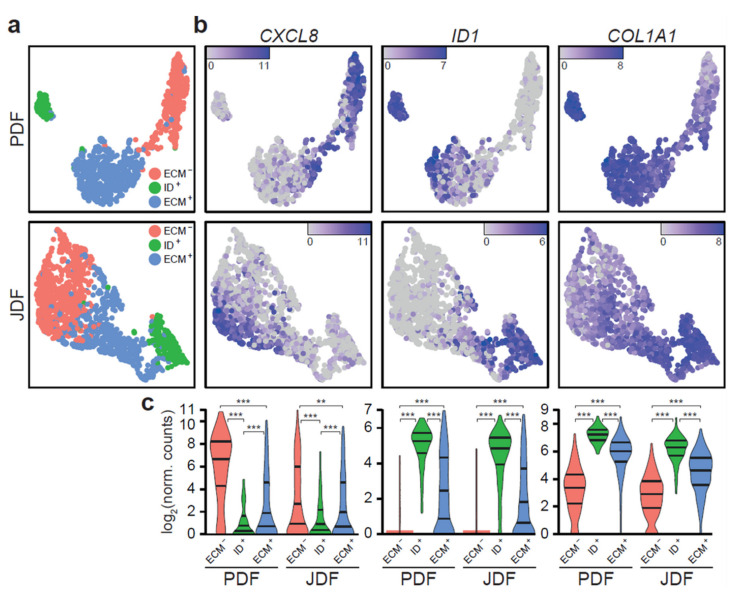
Figure 2.
Fibroblasts in JDF and PDF spheroids split into three phenotypically distinct clusters. (a) The clusters are defined by specific gene expression signatures and separate well in the UMAP visualisation. (b) ECM- cells produce various cytokines and interleukins (CXCL8), ID+ cells are identified by strong expression of ID genes (ID1), and ECM+ cells by marked expression of ECM components (COL1A1). (c) The clusters are equivalent in JDF and PDF spheroids and display statistically significant differences in expression of their marker genes (** p < 0.01; *** p < 0.001, Mann-Whitney U test).

