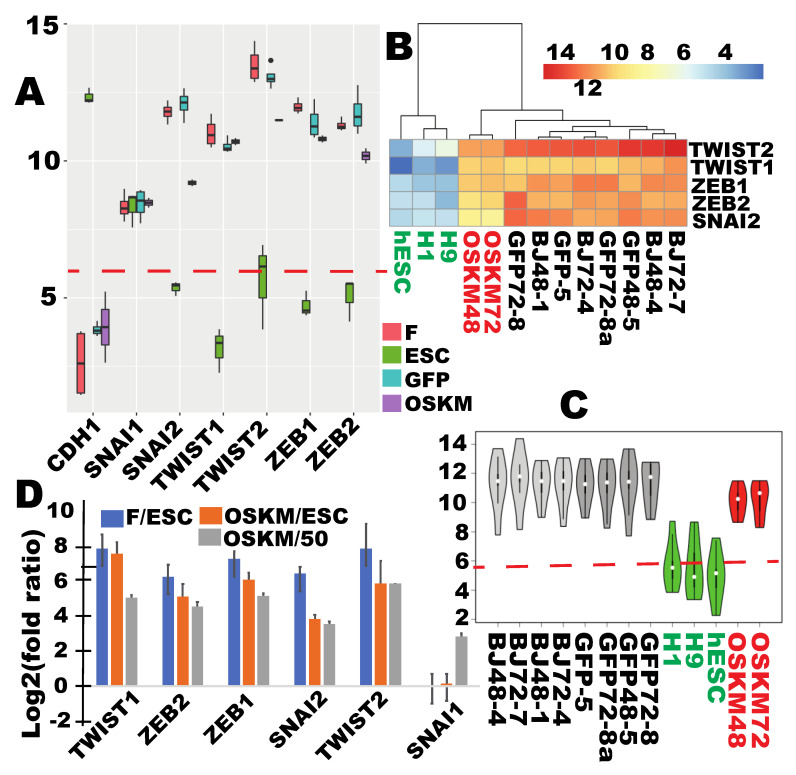
Figure 3.
The key mesenchymal transcriptional factors (TFs) maintained high levels of expressions and the epithelial marker CDH1 remained silenced at the time of proper RB reprogramming. (A) Box plots for individual genes showing little reprogramming of mesenchymal TFs, and of the epithelial marker gene CDH1 at the early time of OSKM reprogramming (log2-transformed averaged read counts for time points of 48 and 72 h). (B) Clustering and the associated heat map showing lack of substantial downreprogramming of the five mesenchymal TFs. (C) Violin plots of each sample for the six mesenchymal TFs showing little reprogramming as a group upon OSKM induction. (D) Log2 (fold differences) relative to ESCs (blue and orange bars) or to the threshold level read counts (50) for the expressed genes (grey bars). F in (A) and (D) stands for fibroblasts. Dashed red lines in (A) and (C) mark the threshold level of the expressed genes. Sample labels are the same as in Figure 2. See also Supplementary Figure S7 and Supplementary Table S11.

