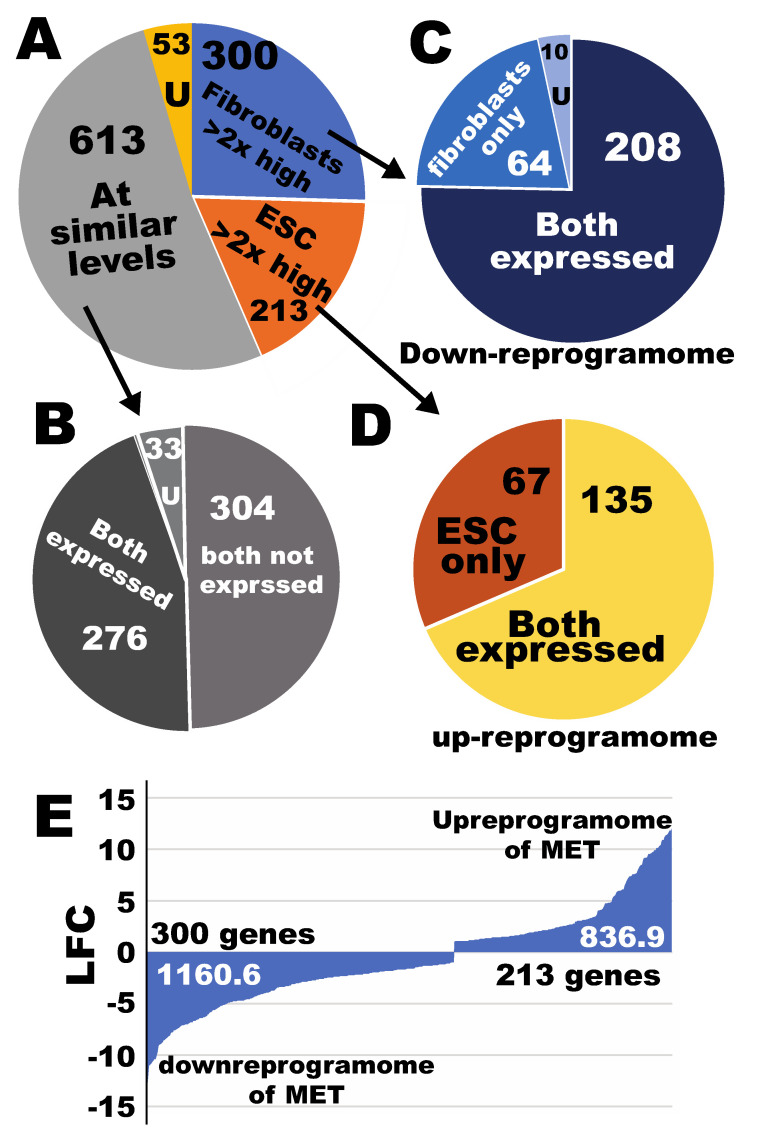
Figure 4.
Defining the subreprogramomes for the mesenchymal-to-epithelial (MET) transition during the iPSC reprogramming process from human fibroblasts. (A) A pie chart for classification of the MET/EMT genes in the context of human fibroblast-to-iPSC reprogramming. (B) sub-classification for the sector of “at similar levels” in (A). (C) Sub-classification for the sector of fibroblast-enriched genes in pie chart (A). (D) Sub-classification for the sector of hPSC-enriched genes in pie chart (A). (E) Quantification of reprogrammikng for the MET subreprogramomes. LFC, log2 (fold changes); U, uncertain genes based on the sorting criteria. See also Supplementary Figures S8–S13 and Supplementary Tables S12–S14.

