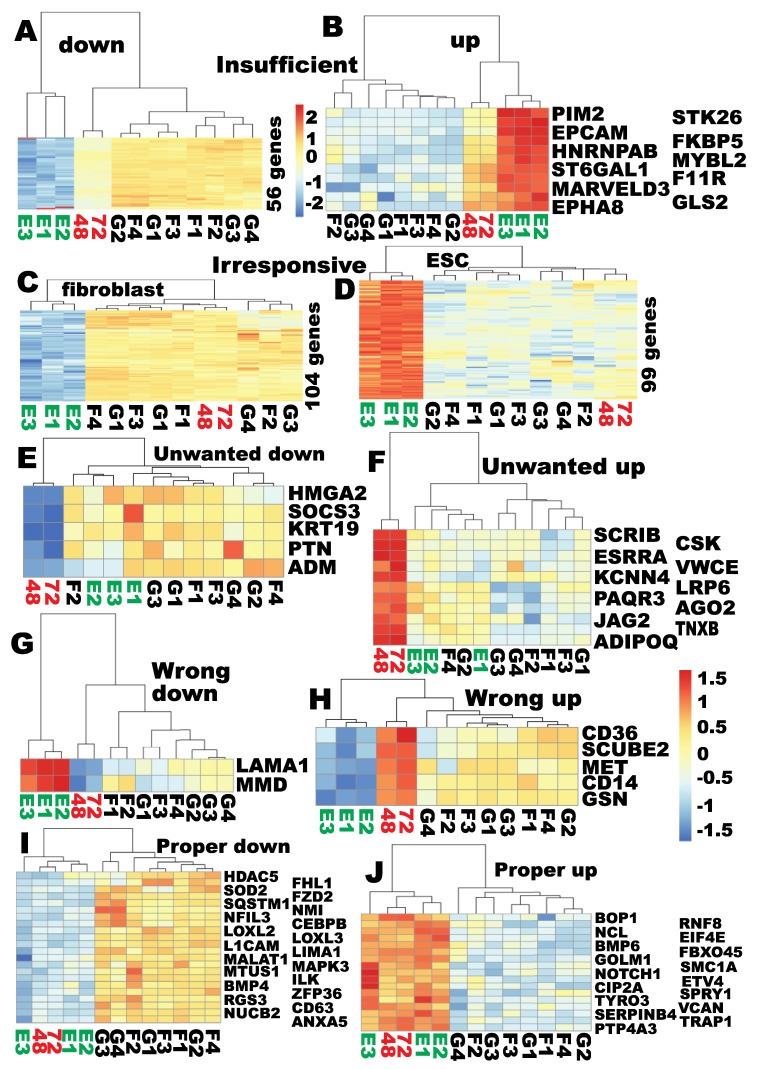
Figure 6.
A Proper, Insufficient, Aberrant, and NO reprogramming (PIANO) response of the annotated MET genes to OSKM reprogramming at the time of proper RB reprogramming. (A) insufficient downreprogramming (56 genes); (B) insufficient upreprogramming (11 genes); (C) 104 fibroblast-enriched genes were irresponsive to OSKM reprogramming; (D) 99 hPSC-enriched genes were irresponsive to OSKM reprogramming; (E) 5 common MET genes were downregulated when they should have not been; (F) 11 common MET genes were upregulated when they should have not been; (G) 2 MET genes were wrongly downregulated when they should have been upreprogrammed; (H) 5 MET genes were wrongly upregulated when they should have been downreprogrammed; (I) 22 fibroblast-enriched genes were properly downreprogrammed; (J) 17 hPSC-enriched genes were properly upreprogrammed. Color scales of read counts are the same as shown by heat map (A), except for (B), (G), and (H) that share the second color scales as shown by (H). See also Supplementary Figure S15.

