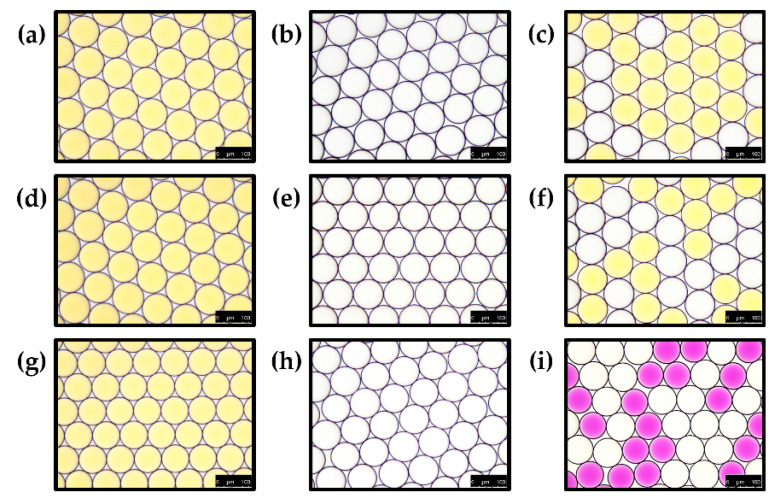
Figure 12.
Identification of ammonia gas production within droplets and gas crosstalk between droplets. Phenol red droplets (a,d,g) were mixed sodium hydroxide-containing droplets (b), ammonium chloride-containing droplets (e) or co-encapsulated droplets with sodium hydroxide and ammonium chloride (h). Droplet mixtures (c,f,i) were then imaged under a DMi-8 microscope (scale bar = 100 μm).

