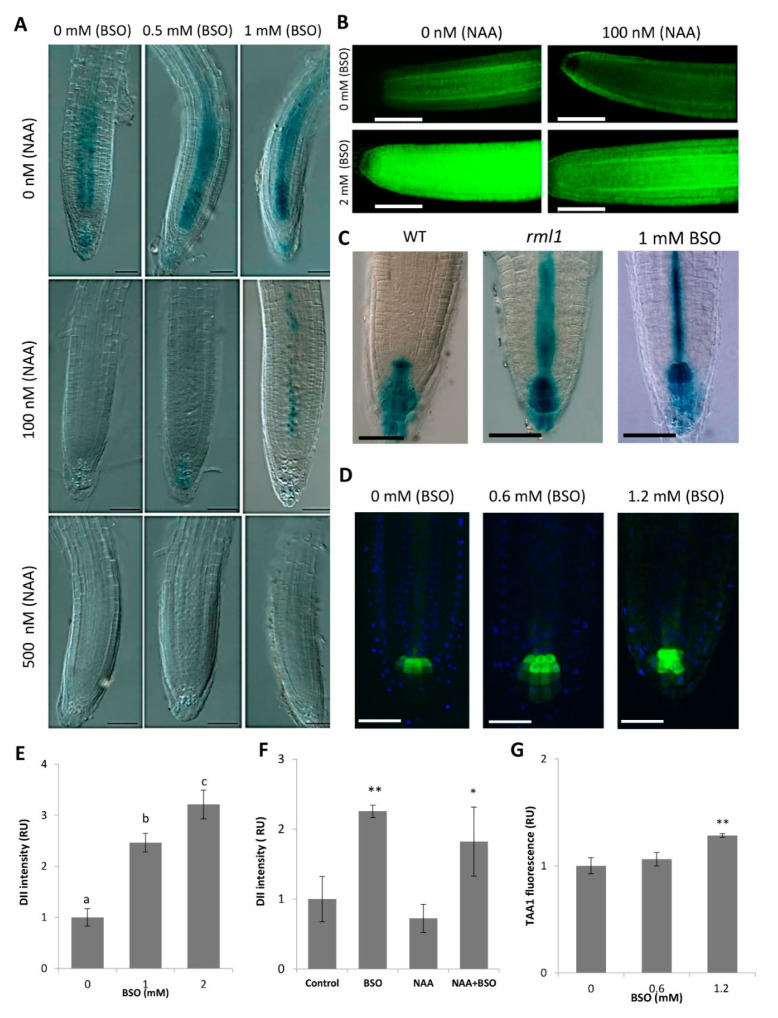
Figure 3.
Effect of GSH level on auxin response markers and auxin biosynthesis gene expression. (A) BSO dose-dependently increases AXR3NT-GUS stability in response to auxin. Seven-day-old seedlings were treated for 12 h with different L-buthionine-(R,S)-sulfoximine (BSO) concentrations in the liquid medium and/or pre-treated in the control medium. Seedlings were subjected to heat shock by cultivation at 37 °C for 1.5 h, allowed to recover for the next 10 min, and then subjected to GUS assays for the next 1–1.5 h; (B) BSO increases DII::VENUS stability without and with NAA application; (C) DR5::GUS signal in wildtype seedlings, rml1 mutant seedlings, and seedlings treated with 1 mM BSO; (D) TAA1::GFP signal in RAM upon BSO treatment. Scale bar −50 µm. (E) DII::VENUS quantification in response to BSO concentrations. Error bars represent the means ± SDs (n = 6). Different letters indicate a significant difference at p < 0.05; (F) DII::VENUS quantification following BSO and NAA treatments (represented image in B). Error bars represent the means ± SEs (n = 6); (G) TAA1::GFP quantification in RAM (represented image from D). Error bars represent the means ± SDs (n = 8). Means of treatments with * and ** are significantly different from means of the control at p < 0.05 and p < 0.01, respectively. Fisher’s protected LSD test was used to compare the individual means.

