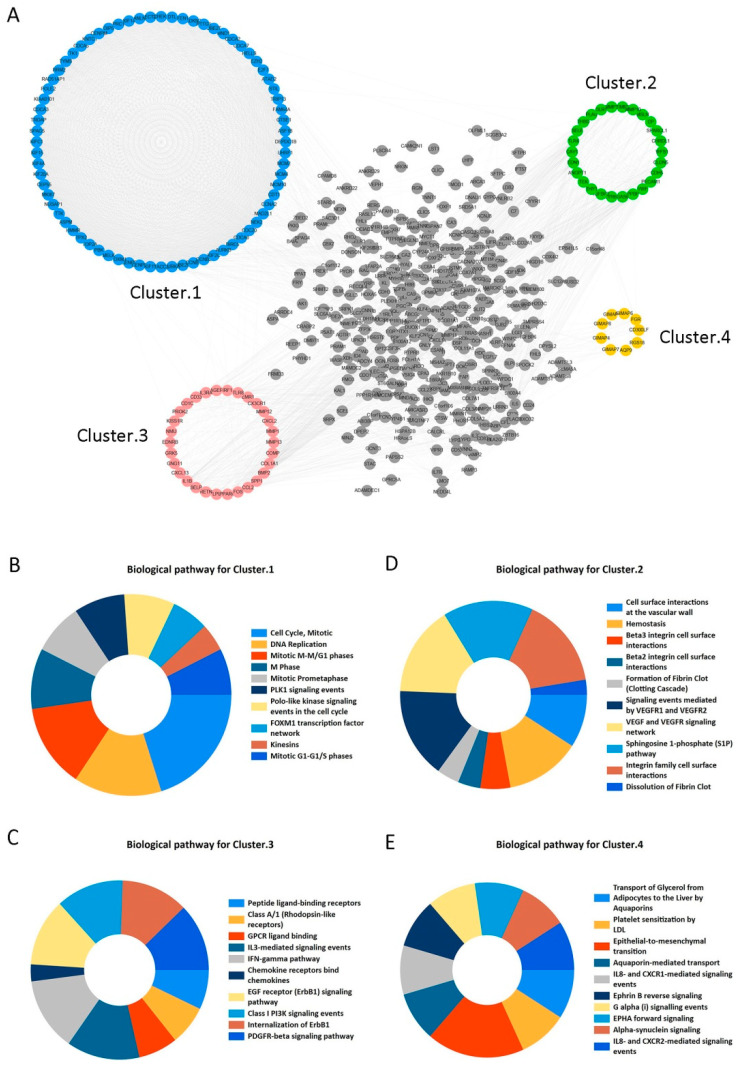
Figure 3.
Protein-protein interaction (PPI) network construction and enrichment analysis for modules. (A) PPI network and module clustering analysis for the 573 shared DEGs. Blue, green, pink, and orange nodes represent the four clustering modules, of which cluster 1 (blue) had the highest MCODE score. (B–E) Biological pathway analysis for cluster 1 (B), cluster 2 (C), cluster 3 (D), and cluster 4 (E). Significant signaling pathways were mainly involved in cell cycle and DNA Replication.

