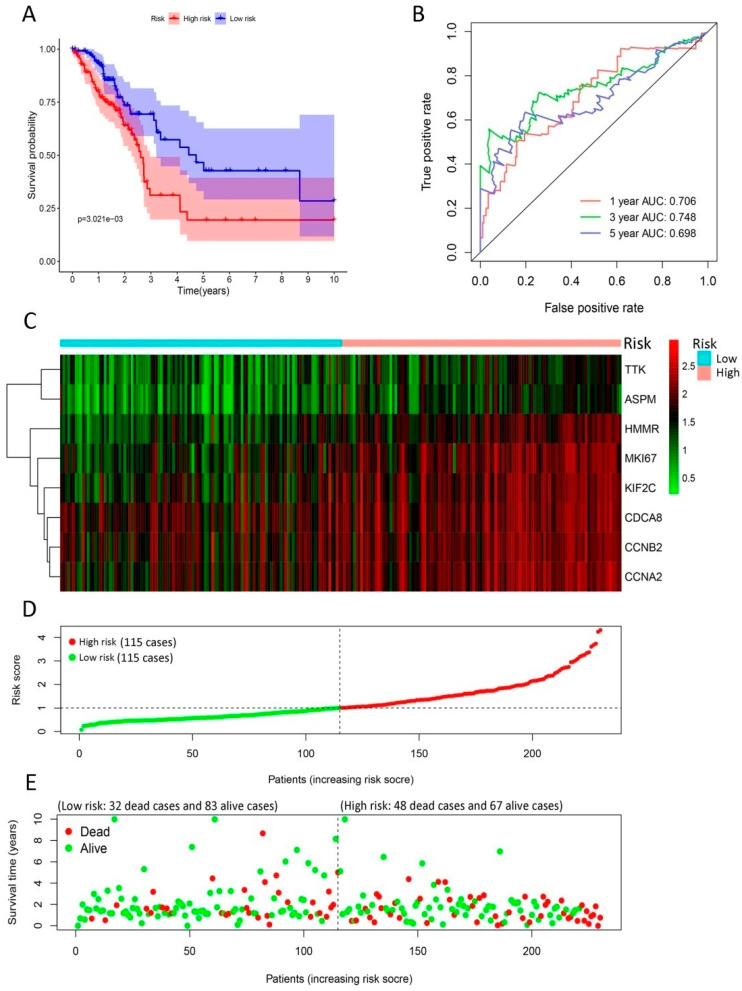
Figure 4.
Development of gene signature in the training group. (A) Survival curves of high- and low-risk groups separated by gene signature. (B) Receiver operating characteristic (ROC) curves for survival risk predicted by gene signature for 1-, 3-, and 5-year follow-ups. (C–E) Expression heatmap of eight signature genes (C), risk score distribution (D), and survival status of patients (E). The risk score based on gene signature appears to be correlated with survival status for lung cancer patients in low- and high-risk groups.

