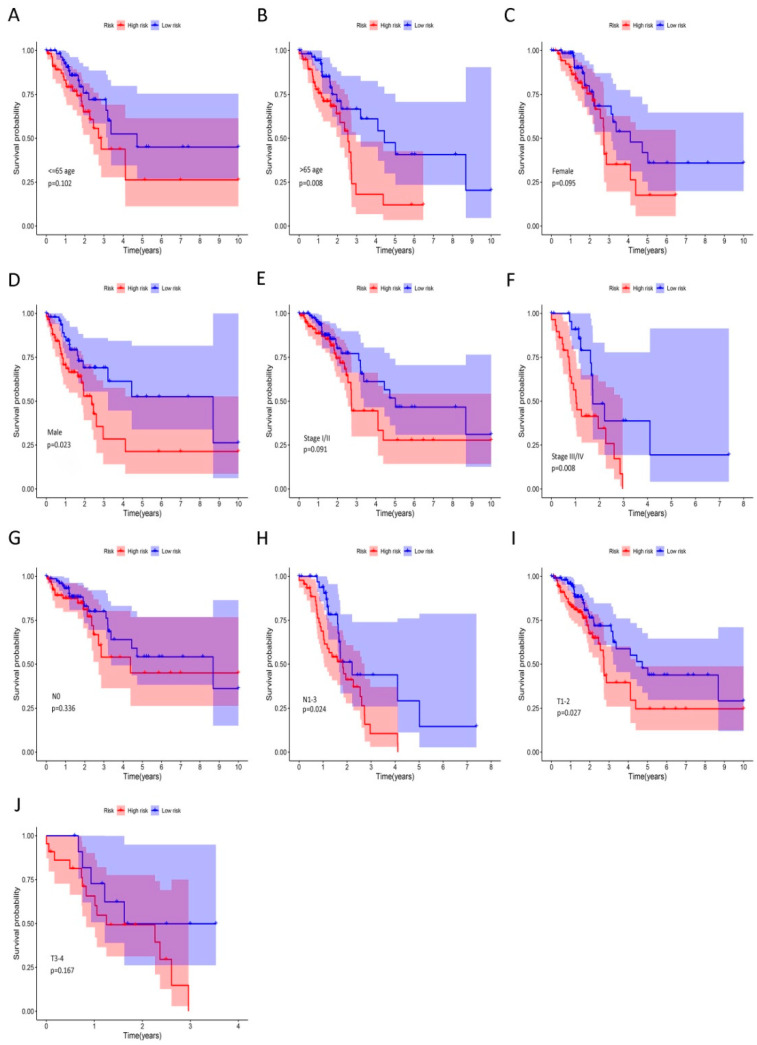
Figure 6.
The prognostic value of riskscore signature in LUAD. (A–J) Kaplan–Meier curves for OS in patients with LUAD; clinical characteristics include age: ≤65 (A) and >65 (B), gender: female (C) and male (D), clinical stage I/II (E) and III/IV (F), lymph node metastasis: N0 (G) and N1-3 (H), and primary tumor: T1-2 (I) and T3-4 (J). Male, >65 age, stage III/IV, N1-2 and T1-2 subgroups were significantly associated with worse OS in high-risk group with respective p < 0.05.

