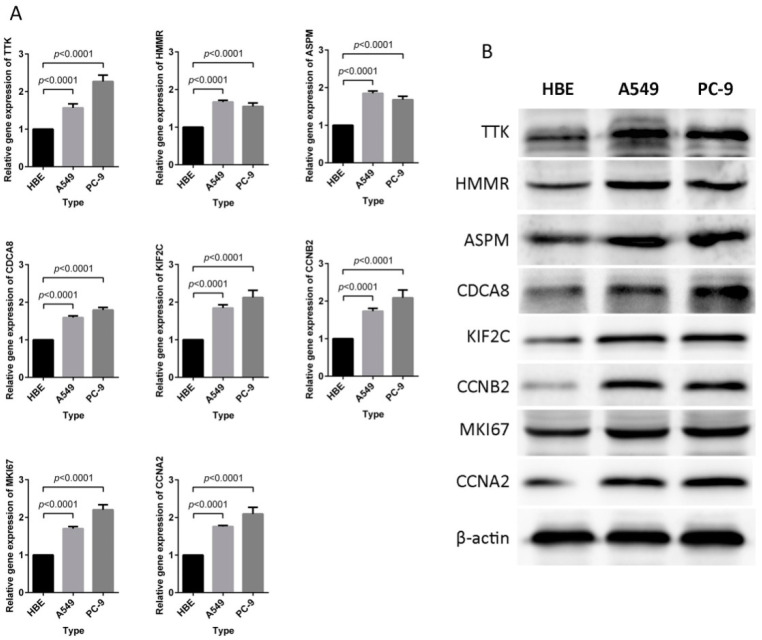
Figure 8.
Expression profiles of eight signature genes in the HBE, A549, and PC-9 cell lines. (A) RT-PCR analysis of relative mRNA expression. The genes expression levels for each of the eight genes were significantly increased in A549 and PC-9 cells compared to HBE cells (p < 0.0001). (B) Western blot analysis of protein expression levels. Every protein appeared to have higher expression levels in A549 and PC-9 cells compared with HBE cells. The measurements of mRNA and protein expression levels were performed in triplicate.

