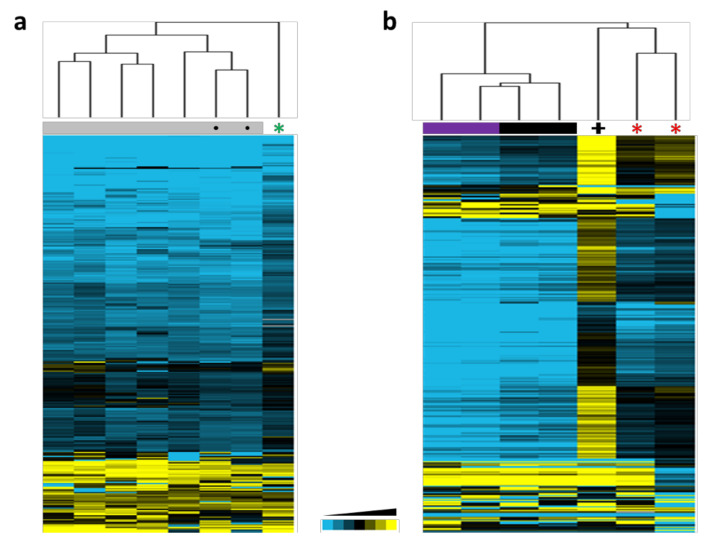
Figure 3.
Hierarchical clusterings using methylation data from 307 probes found significantly differentially methylated between DNMT3A-mutated and non-mutated tissues in patients with PPGL [15]. (a) Unsupervised profiling using saliva DNA from the index patient (denoted with a green asterisk), in-home healthy controls (denoted with grey boxes and a dark circle) and healthy donors obtained from Gene Expression Omnibus (GEO) (denoted with grey boxes). (b) Profiling using methylation data from blood DNA obtained from two patients with PPGL (denoted with red asterisks) [15] compared to methylation data (GSE120428) [16] corresponding to: one patient with microcephalic dwarfism (denoted with a black cross), two patients with TBRS (denoted with purple boxes) and two controls (indicated with black boxes).

