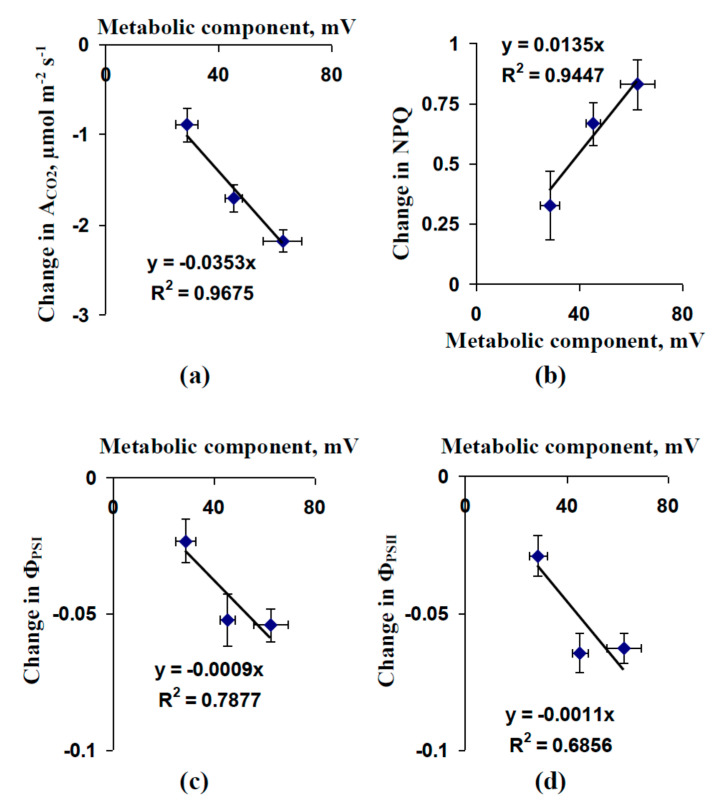
Figure 5.
Scatter plots between the values of the metabolic component of the membrane potential and magnitudes of local burning-induced changes in photosynthetic CO2 assimilation (ACO2) (a), non-photochemical quenching of chlorophyll fluorescence (NPQ) (b), and quantum yields of photosystems I (ΦPSI) (c) and II (ΦPSII) (d), in the second leaf of pea seedlings. Data from Figure 1 and Figure 3 were used.

