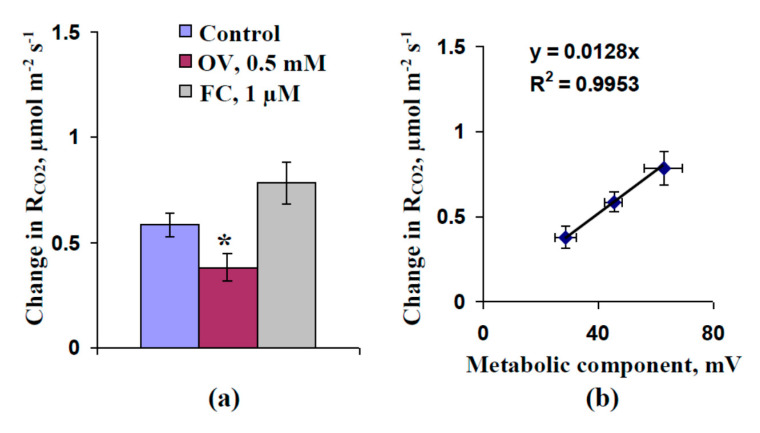
Figure 7.
Magnitudes of local burning-induced changes in respiration (RCO2) (a) and scatter plot between the values of the metabolic component of the membrane potential and the magnitudes of these changes (b) (n = 5–6). Respiration was measured under dark conditions. The preliminary OV (0.5 mM) and FC (1 µM) treatments of the second mature leaves in seedlings were performed by incubation of the leaf (2 h) in solutions of these chemical agents. After that, these leaves were dried using filter paper and used for respiratory measurement. OV and FC were dissolved in standard solution (1 mM KCl, 0.5 mM CaCl2, and 0.1 mM NaCl). Similar incubation in the standard solution was used as a control. The first mature leaf was burned (flame, 2–3 s). The values of the metabolic component were taken from Figure 1. *, significant difference between experiment and control plants (p < 0.05).

