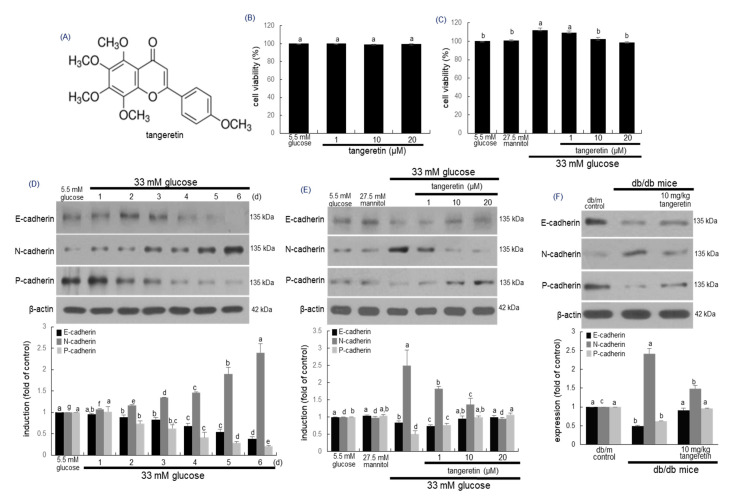
Figure 1.
Chemical structure (A) and cytotoxicity (B,C) of tangeretin, temporal expression of E-cadherin, N-cadherin and P-cadherin in podocytes (D) and modulation of their induction by tangeretin in podocytes and diabetic kidney (E and F). Podocytes were incubated with 33 mM glucose in the presence of 1–20 μM tangeretin for 4 days. Cell viability (mean ± SEM, n = 5) was measured by MTT assay and expressed as percent cell survival relative to glucose controls (B,C). The db/db mice were orally supplemented with 10 mg/kg tangeretin for 10 weeks (F). Podocyte lysates and kidney tissue extracts were electrophoresed on 8–10% SDS-PAGE and subject to Western blot analysis with a primary antibody against E-cadherin, N-cadherin and P-cadherin (D–F). β-Actin antibody was used as an internal control. The bar graphs (mean ± SEM, n = 3) in the bottom panels represent quantitative results of upper blot bands obtained from a densitometer. Means in bar graphs without a common letter differ, p < 0.05.

