Figure 3.
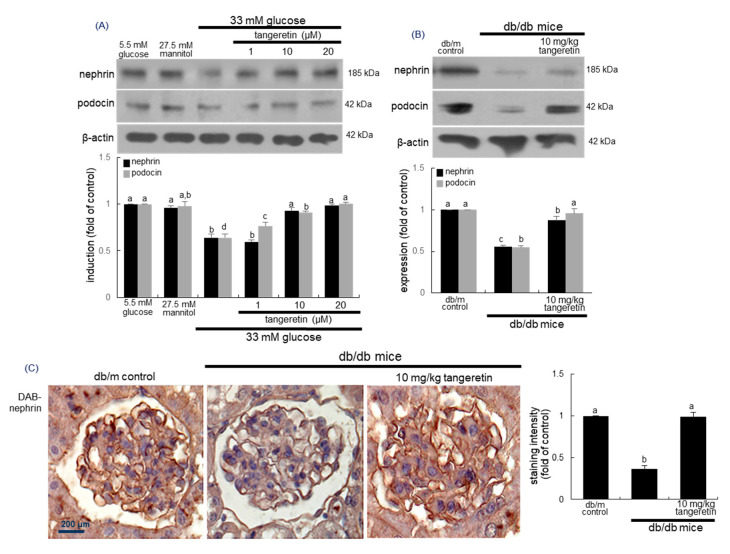
Elevation of induction of nephrin and podocin by tangeretin in podocytes and diabetic kidneys. Podocytes were incubated with 33 mM glucose in the presence of 1–20 μM tangeretin for 4 days (A). The db/db mice were orally supplemented with 10 mg/kg tangeretin for 10 weeks (B,C). Cell lysates and tissue extracts were electrophoresed on 8–12% SDS-PAGE and subject to Western blot analysis with a primary antibody against nephrin and podocin (A,B). β-Actin antibody was used as an internal control. The bar graphs (mean ± SEM, n = 3) in the bottom panels represent quantitative results of upper blot bands obtained from a densitometer. Respective values not sharing a letter are different at p < 0.05. Immunohistochemical staining showing glomerular tissue level of nephrin of diabetic mouse kidney (C). The glomerular nephrin was confirmed with 3,3′-diaminobenzidine (DAB), producing a brown staining, counterstained with hematoxylin and was quantified. Each photograph is representative of four mice. Scale bar = 200 μm.

