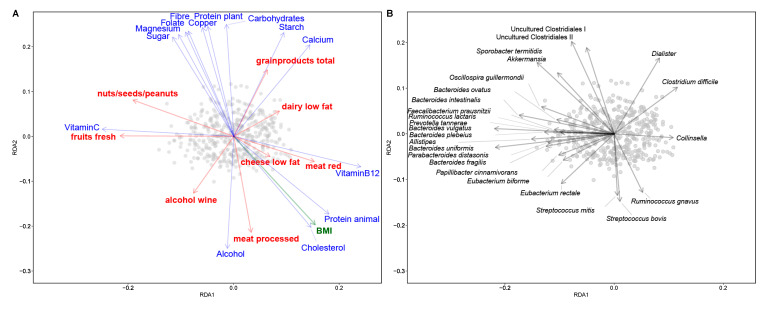
Figure 2.
Association of microbiota with food groups, nutrients and BMI. Samples are plotted as grey circles. (A) Redundancy analysis (RDA) bi-plot of microbiota with explanatory variables; food groups (red), nutrients (blue) and phenotypical characteristics (green). (B) RDA bi-plot of samples with the associated microbial taxa (indicated as genera or species-level groups) The direction of the arrows depicts the abundance of microbial taxa. Length of the arrows is a measure of fit. The variable arrows approximate the correlation between species and explanatory variables. Samples near the coordinate origin (zero point) suggest near zero correlation. The further a sample falls in the direction indicated by the arrow, the higher the correlation.

