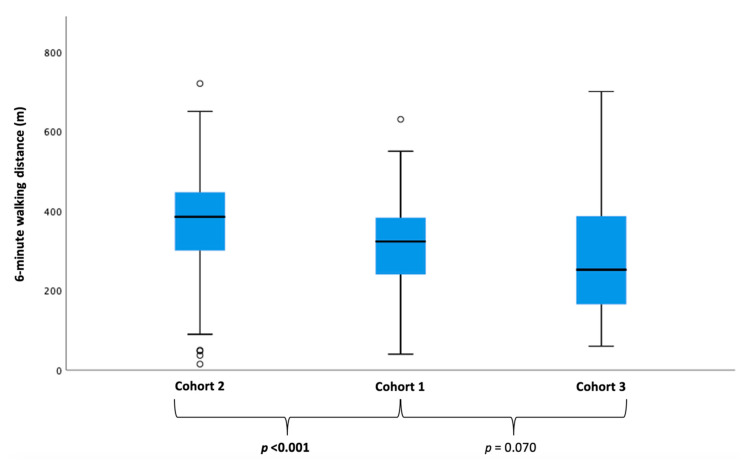
Figure 3.
Between-cohort differences in exercise capacity. Boxplots showing median 6-min walking distances of the PARAGON-like proportion of the real-world HFpEF cohort (Cohort 1), patients who did not meet the inclusion criteria (± fulfilled exclusion criteria) (Cohort 2) and patients who would have been excluded (Cohort 3). Kruskal–Wallis test was performed and showed a significant difference across the different cohorts (p < 0.001).

