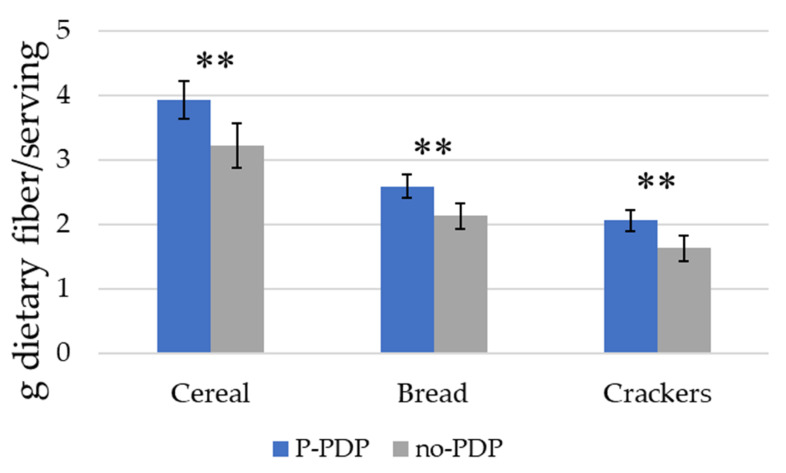
Figure 4.
The dietary fiber content of product choices made by participants in P-PDP and no-PDP conditions. Error bars represent the 95% confidence interval around the mean. The analyses included only those subjects that made a product choice; 24 (3.2%), 19 (2.5%), and 18 (2.4%) participants who had selected “none of these” in the cereal, bread, and cracker models were omitted prior to the analyses. This left n = 729 cereal choices, n = 734 bread choices, and n = 735 cracker choices. ** p < 0.01. Notes: no-PDP = participants were not exposed to a prompt); P-PDP = pooled prompt condition.

