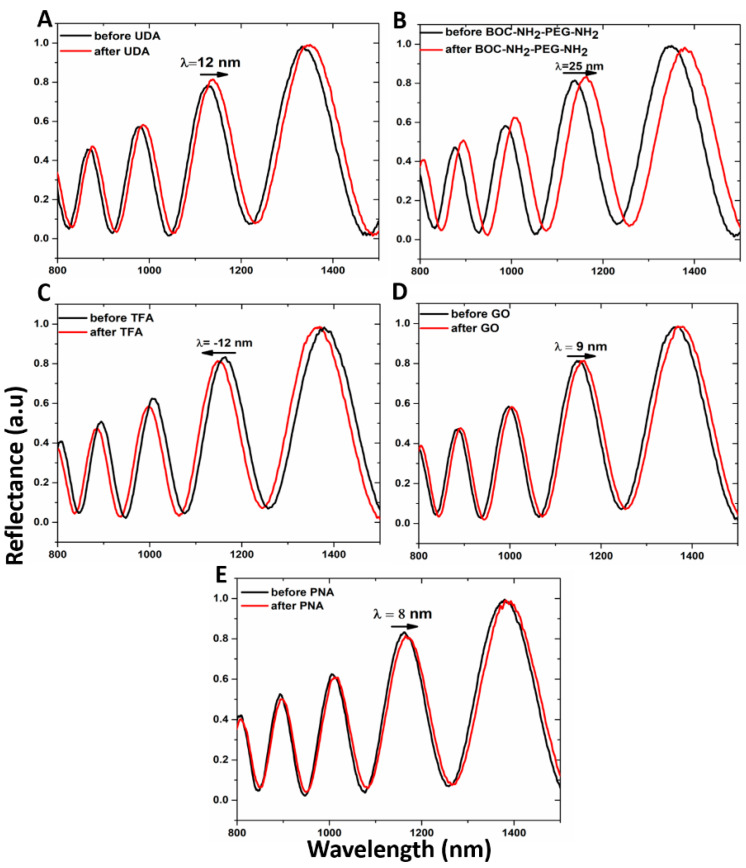
Figure 4.
Reflectivity spectra of PSi (A) before (black line) and after (red line) UDA passivation, (B) before (black line) and after (red line) PEGylation with BOC-NH2-PEG-NH2, (C) before (black line) and after (red line) deprotection of amino group by TFA treatment, (D) before (black line) and after (red line) GO infiltration, (E) before (black line) and after (red line) PNA immobilization.

