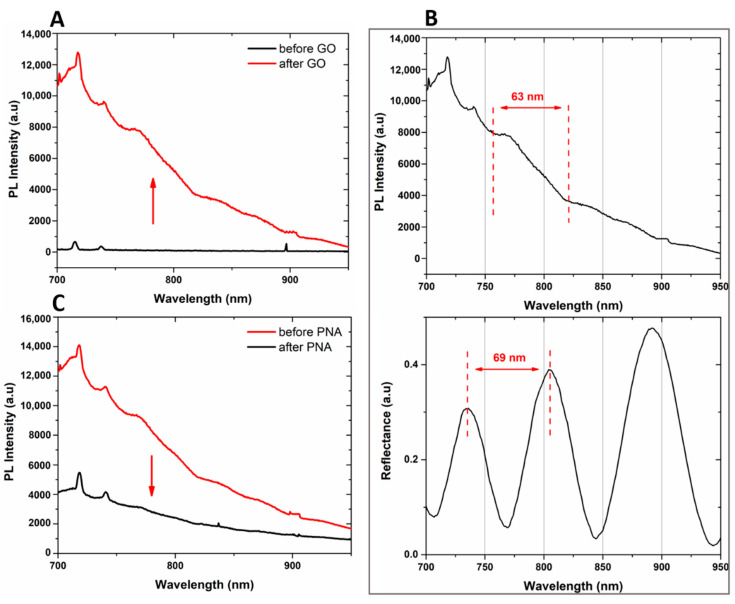
Figure 5.
(A) photoluminescence spectra of PSi before (black line) and after (red line) GO infiltration at an excitation wavelength of 442 nm. (B) Comparison between PL spectrum (upper graph) and reflectivity spectrum (lower graph) of GO/PSi hybrid device. (C) PL spectra of PSi before (red line) and after (black line) PNA immobilization, at an excitation wavelength of 442 nm.

