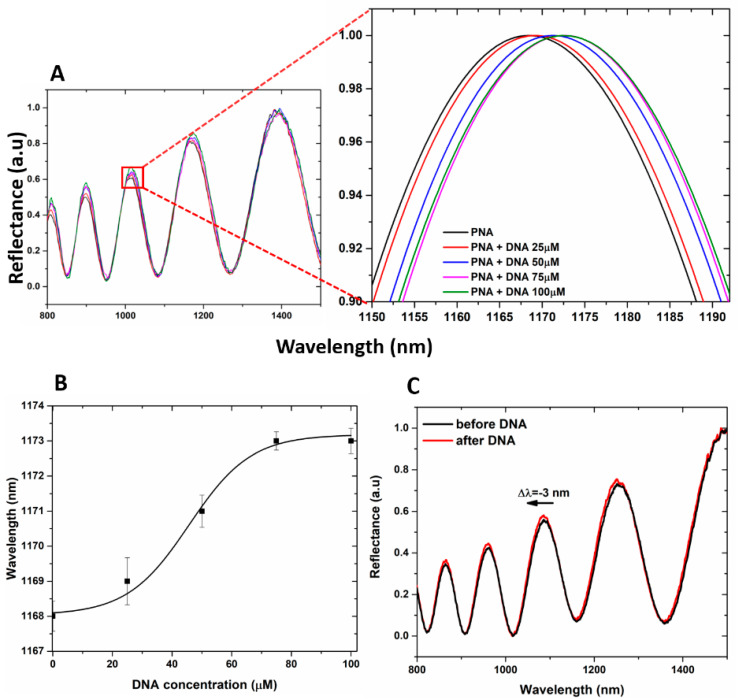
Figure 6.
(A) reflectivity spectra of PNA-GO/PSi device after the DNA incubation at pH 5. (B) dose–response curve as a function of the DNA concentration (pH 5). Experimental data (black squares) were fitted by using OriginLabTM Dose–response nonlinear curve fit. (C) reflectivity spectra of PNA-GO/PSi device after the DNA incubation at pH 7.5.

