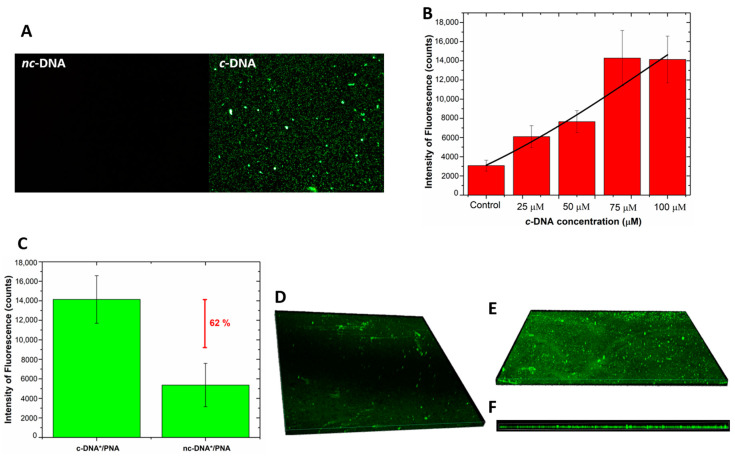
Figure 8.
(A) fluorescence images of PNA-GO/PSi device incubated with fluorescent DNA (c-DNA) and DNA polyT (nc-DNA) at magnification 50×; (B) fluorescence intensity as a function of c-DNA concentration. The values were calculated by averaging different images of the same sample. Data were fitted by using OriginLabTM Dose–response non-linear curve fit; (C) comparison between fluorescence intensity values of PNA-GO/PSi device after the interaction with 100 µM of fluorescent c-DNA (c-DNA*) and 100 µM of fluorescent nc-DNA (nc-DNA*); (D) top view of the fluorescent DNA infiltrated in the GO/PSi device (negative control); (E) top view and (F) side view of PNA/DNA infiltrated into PSi.

