Figure 2.
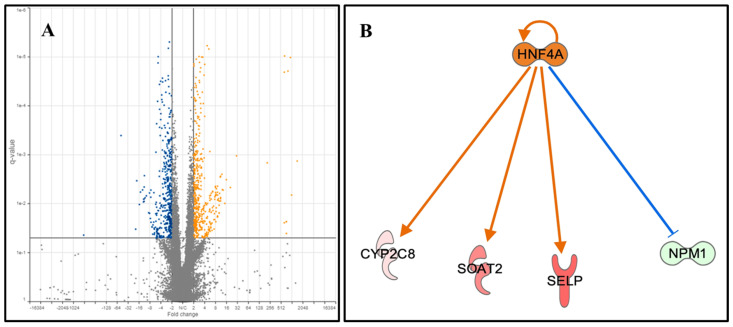
Differential expressed genes between OLP patients and healthy individuals. (A). Volcano plot illustrating differentially expressed genes identified between OLP patients and healthy controls. Y axis indicates false discovery rate (FDR)-adjusted p-values, while the x axis indicated the fold change between OLP and Controls. Overall, we identified 959 differentially expressed genes, of which 503 were upregulated and 456 were downregulated between OLP patients and controls. Further analysis of the differentially expressed genes identified hepatocyte nuclear factor 4 alpha (HNF4A) as a significant upstream regulator of the identified differentially expressed genes. (B). The hepatocyte nuclear factor alpha (HNF4A) gene network is activated in OLP patients. Differential gene expression analysis indicated that the HNF4A gene network is activated in OLP patients. Comparing to healthy individuals, HNF4A and its downstream targets, CYP2C8, SOAT2 and SELP are upregulated in OLP samples, while the inhibitor of HNF4A, NPM1 is downregulated in OLP compared to healthy individuals. Red: upregulation in OLP, Green: Downregulated in OLP.

