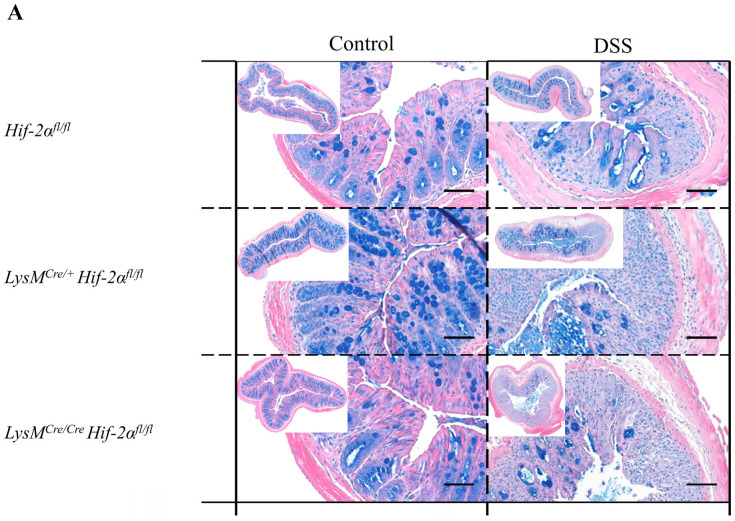
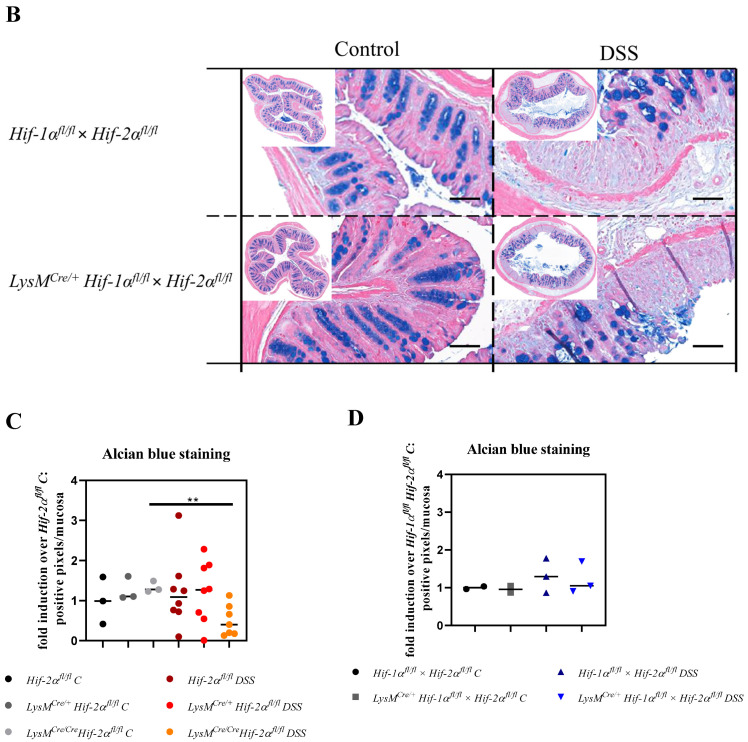
Figure 4.
Reduced mucin production after tissue destruction. Exemplary presentation of alcian blue-stained colon tissue sections of (A) Hif-2αfl/fl, LysMCre/+ Hif-2αfl/fl and LysMCre/Cre Hif-2αfl/fl animals and (B) Hif-1αfl/fl × Hif-2αfl/fl and LysMCre/+ Hif-1αfl/fl × Hif-2αfl/fl animals with and without DSS treatment and quantification of histological data (C,D). No positive alcian blue staining was observed in damaged colon areas. Statistical analysis was performed with an unpaired t-test; (A): n(Control) = 3 (LysMCre/Cre Hif-2αfl/fl)/5 (Hif-2αfl/fl, LysMCre/+ Hif-2αfl/fl), n(DSS) = 8 (LysMCre/Cre Hif-2αfl/fl)/12 (Hif-2αfl/fl, LysMCre/+ Hif-2αfl/fl), (B): n(Control) = 2, n(DSS) = 3. counterstaining: eosin. Magnification overview image: 100×; magnification detail image: 200×; and scale bar: 100 µm, (C,D): every indicated spot depicts the quantitative analysis of a complete cross section of one colon. **: p < 0.01.


