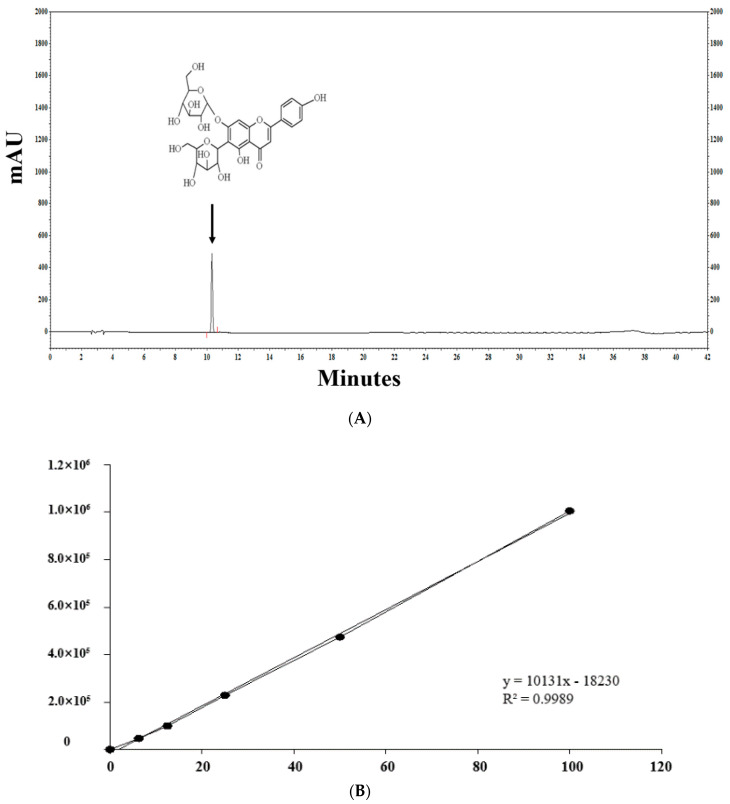
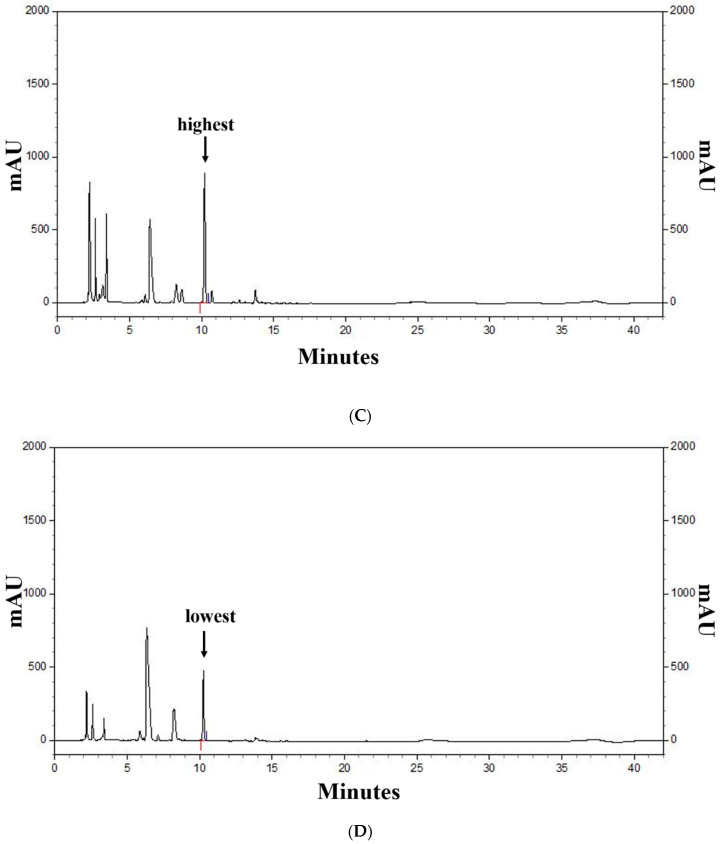
Figure 2.
HPLC chromatogram of the standard and barley sprout extracts (BSE) and a graph of the top and bottom five BS samples for saponarin content. HPLC chromatogram standard (A) and standard quantitative curve (B), and HPLC chromatogram of the BS samples with the highest (C) and the lowest saponarin contents (D). Saponarin appeared with retention times of approximately 10.3 min at 254 nm.


