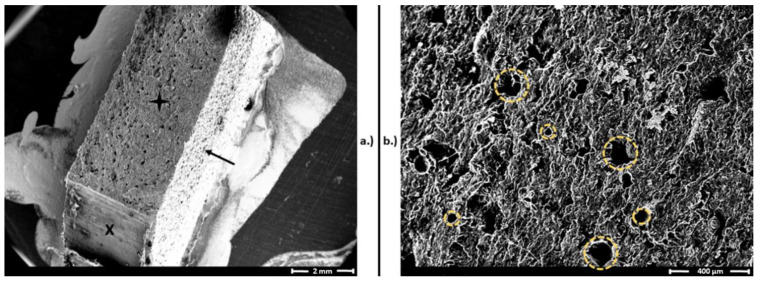
Figure 5.
Scanning electron microscopy (SEM) images of a polyamide (PA) (selective laser sintering (SLS)) test bar after the Charpy impact test. (a) Broken surface of the test specimen, marked with a black star, similar to the intact surface (black arrow). The “X” represents a surface after cutting the test specimen to prepare the SEM sample. Magnification: 10×. (b) Surface and pores of PA test bars from the broken surface. The yellow dashed circles represent the pores, with sizes varying from 15 to 150 µm. Magnification: 60×.

